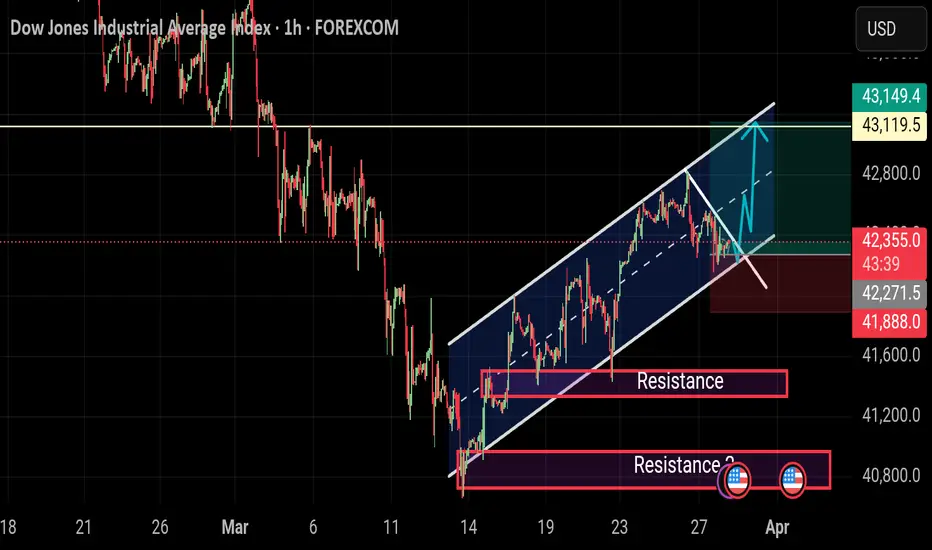
Falling towards pullback support?Dow Jones (US30) is falling towards the pivot and could bounce to the 1st resistance which has been identified as a pullback resistance.
Pivot: 42,114.80
1st Support: 41,410.00
1st Resistance: 43,012.90
Risk Warning:
Trading Forex and CFDs carries a high level of risk to your capital and you should only trade with money you can afford to lose. Trading Forex and CFDs may not be suitable for all investors, so please ensure that you fully understand the risks involved and seek independent advice if necessary.
Disclaimer:
The above opinions given constitute general market commentary, and do not constitute the opinion or advice of IC Markets or any form of personal or investment advice.
Any opinions, news, research, analyses, prices, other information, or links to third-party sites contained on this website are provided on an "as-is" basis, are intended only to be informative, is not an advice nor a recommendation, nor research, or a record of our trading prices, or an offer of, or solicitation for a transaction in any financial instrument and thus should not be treated as such. The information provided does not involve any specific investment objectives, financial situation and needs of any specific person who may receive it. Please be aware, that past performance is not a reliable indicator of future performance and/or results. Past Performance or Forward-looking scenarios based upon the reasonable beliefs of the third-party provider are not a guarantee of future performance. Actual results may differ materially from those anticipated in forward-looking or past performance statements. IC Markets makes no representation or warranty and assumes no liability as to the accuracy or completeness of the information provided, nor any loss arising from any investment based on a recommendation, forecast or any information supplied by any third-party.
US30 trade ideas

Stocks likely to dip lowerStocks likely to drop lower, inflation is still hot. Trade Safe - Trade Well.

Hanzo | US30 15 min Breaks – Will Confirm the Next Move🆚 US30
The Path of Precision – Hanzo’s Market Strike
🔥 Key Levels & Breakout Strategy – 15M TF
🔥 Deep market insight – no random moves, only calculated execution.
☄️ Bullish Break Out Setup – 42150 Zone
Price must break liquidity with high volume to confirm the move.
☄️ Bearih Break out Setup – 41730 Zone
Price must break liquidity with high volume to confirm the move.
🩸 15M Time Frame Confluence
————
CHoCH & Liquidity Grab @ 19100
Key Level / Equal Highs Formation
Strong Rejection from 18800 – The Ultimate Pivot
🔥 1H Time Frame Confirmation
Twin Wicks @ 41740 : 42150 – Liquidity Engineered
BOS @ — 41750 | 42050 – Directional Shift Confirmed
☄️ 4H Historical Market Memory
——
💯 March 17, 2025 – First Retest @ 41830
💯 March 20, 2025 – Second Retest @ 41830
💯 March 24, 2025 – Third Retest @ 41830
💯 March 31, 2025 – Fourth Retest @ 41830
👌 The Market Has Spoken – Are You Ready to Strike?

DOW JONES Last chance to buy before it breaks the 1D MA50.Dow Jones (DJIA) has been trading within a 1.5 year Channel Up pattern since the July 2023 High. The market found itself under heavy pressure recently as the Channel unfolded its Bearish Leg which found Support right below the 1D MA200 (orange trend-line).
As the 1D RSI got oversold (<30.00) and rebounded, this is perhaps the last opportunity to buy low, before it breaks above its 1D MA50 (blue trend-line) on what is technically the new Bullish Leg.
The previous Bullish Leg (November 2023 - March 2024) hit the 2.0 Fibonacci extension on a +23.94% rise, before it broke below its 1D MA50 again. As a result, it is possible for Dow not to break again below its 1D MA50 once broken, before it reaches the 2.0 Fib which sits at 50000. Our Target is a little lower than that at 49000.
-------------------------------------------------------------------------------
** Please LIKE 👍, FOLLOW ✅, SHARE 🙌 and COMMENT ✍ if you enjoy this idea! Also share your ideas and charts in the comments section below! This is best way to keep it relevant, support us, keep the content here free and allow the idea to reach as many people as possible. **
-------------------------------------------------------------------------------
Disclosure: I am part of Trade Nation's Influencer program and receive a monthly fee for using their TradingView charts in my analysis.
💸💸💸💸💸💸
👇 👇 👇 👇 👇 👇

US30 OUTLOOK DONT CHASE TRADES,WAIT FOR TRADES
Market Structure:
Downtrend: The overall structure shows lower highs and lower lows, indicating a bearish market.
Recent Price Action: Price has recently made a sharp drop and is currently bouncing off a possible support level.
Key Levels:
Resistance: ~42,400 (previous lower high)
Support: ~41,200 (recent low where price bounced)
Potential Setups:
Bearish Continuation: If price reaches the 42,000–42,400 zone and rejects with strong bearish candlestick patterns, it could indicate another leg down.
Bullish Reversal: If price forms a higher low above 41,200 and breaks above 42,000 with strong momentum, a reversal could be in play.
Range Play: If price consolidates between 41,200 and 42,000, possible scalping opportunities within the range.
Confirmation:
Look for candlestick confirmations (e.g., bearish engulfing for a sell, bullish engulfing for a buy).
Use volume analysis to confirm breakout strength.
Monitor economic news for potential volatility.

DJI - channel retest, hidden bearish divergenceI think DJI will retest the broken channel at 0.5 fib retracement and will be rejected from it. There is also 4h hidden bearish divergence (1d on US30). I expect SPX and NDX to fall simultaneously with DJI.

SHORT ON US30US30 Has given a change of character (choc) on the 4hr TF indicating the end of its uptrend pullback on its overall downtrend.
I will be selling US30 to the next level of demand looking to capture over 1000 points.

#US30 – Bearish Breakdown from Rectangle Pattern | 1D AnalysisThe Dow Jones Industrial Average (DJIA) has completed a breakdown from a rectangle consolidation pattern, signaling a potential bearish continuation. The index is currently trading around 41,790, with downside momentum increasing.
Technical Analysis:
Rectangle Pattern Breakout – Bearish continuation after range-bound movement
Double Top Formation – Confirmed rejection near 45,000 resistance
Projected Target: 38,000 (as per the pattern breakdown)
Immediate Resistance: 42,000 - 43,200
Fundamental Outlook:
Market sentiment affected by interest rate policy & economic uncertainty
Weak earnings reports and recession fears could add further downside pressure
If DJIA remains below resistance, we could see further declines toward 38,000. However, a break back above 43,200 could invalidate the bearish setup. Watch for volume confirmation and macroeconomic developments!

US30 bullish LongWall Street goes full bull with tariffs and payrolls looming
I buy the correction
Price closed at low on Friday,for me:Time to buy the correction
Also non farm payrolls looming coming this Friday.
I dont use price action,because it is worthless to use past gone data,on future movements.
Instead I use my favourite commercial analysis
Big commercials buying US30, hedgefunds taking profit and selling it.It means its time to BUY!!!

US30 Weekly Analysis 3.31-4.3Push to the upside today but overall still see us30 bearish and could potentially hit 41000 and even 40750.
Price is below our 4 hr MAs and still below our key levels and trend line on the higher time frame.

TECHNICAL AND FUNDAMENTAL ANALYSIS FOR LONGBuying US30 from 42,300 to 42,200 with a target of 43,100 appears to be a bullish strategy. To justify this move, let's break down the fundamental analysis.
*Market Trend*
The Dow Jones Industrial Average (US30) has been on an upward trend, with a 13.7% increase over the last six months ¹. This suggests a strong bullish momentum.
*Technical Indicators*
- *MACD (Moving Average Convergence Divergence)*: Although the MACD lines remain in bullish territory, the histogram has started to tick lower, indicating a potential weakening of the bullish momentum ¹.
- *RSI (Relative Strength Index)*: The RSI is approaching overbought territory, a level often associated with trend exhaustion ¹.
*Economic Factors*
- *Strong Labor Market*: The US labor market has shown resilience, with strong payroll data and wages growing at 4% ².
- *Interest Rates*: The Federal Reserve's interest rate decisions will impact the US30. A rate cut could boost the index, while a rate hike might lead to a correction ².
*Trading Strategy*
Given the bullish trend and strong labor market, buying US30 from 42,300 to 42,200 with a target of 43,100 seems reasonable. However, keep a close eye on technical indicators and economic factors, as they can impact the index's movement.
*Risk Management*
- *Stop-Loss*: Set a stop-loss at 42,000 to limit potential losses.
- *Position Sizing*: Manage your position size to maintain a risk-reward ratio of 1:1.5.
By considering both technical and fundamental analysis, you can make an informed decision about your trading strategy.
Keep your best wishes to the Travis 👍
US30 3D IdeaPotential for a bearish pullback on the US30 3D which could lead to a price movement towards the support level at 38400. SELL levels from 41900

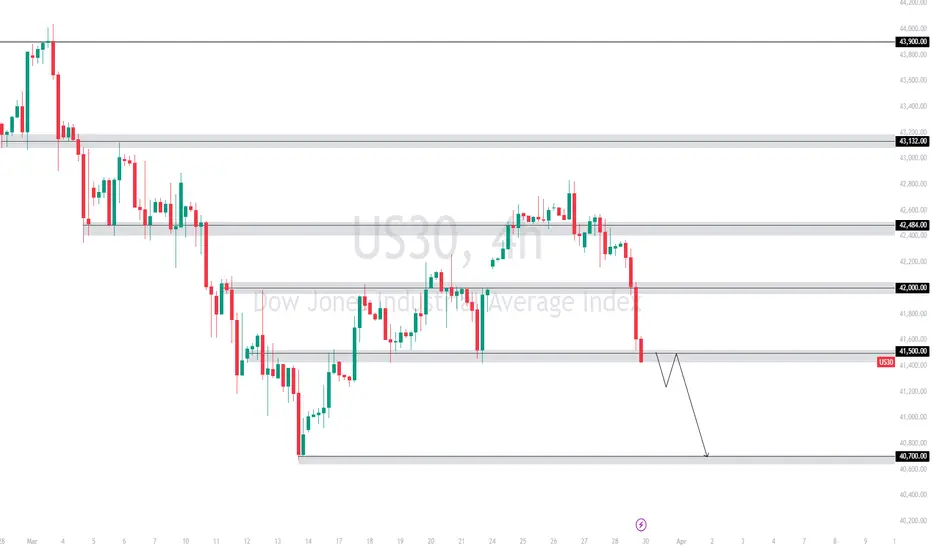
US30 Technical Analysis🔹 Trend Overview:
US30 is in a strong bearish trend after breaking key support levels. The price has dropped significantly and is currently testing the 41,500.00 support zone. If this level fails to hold, further downside is expected.
🔹 Key Levels:
📈 Resistance: 42,000.00 – 42,484.00
📉 Support: 41,500.00 – If broken, price may drop further to 40,700.00
🔹 Market Structure:
⚠️ Bearish scenario: Price could retest 41,500.00 before continuing its downtrend towards 40,700.00
🚀 Bullish scenario: If 41,500.00 holds as support, a short-term pullback toward 42,000.00 is possible.
📌 Risk Management:
-Wait for a confirmation of breakout or rejection before entering trades.
-Monitor for potential fake-outs at 41,500.00 before committing to a position.
US30 Short Trump Tariffs/ Inflation and FEDBad Data! Recession,inflation! That says it all.
Enties exits:See the chart please!

Dow Jones , Double Top continuation Dow Jones Industrial Average (US30) Analysis - March 31, 2025
Chart Structure & Pattern
Head & Shoulders Pattern: The chart shows a clear double head & shoulders formation, which is a strong bearish reversal signal.
Neckline Break: Price has already broken below the neckline of the pattern, confirming a potential downward move.
Retest in Progress: The price is attempting to retest the neckline around the 42,000 - 42,500 zone, which could act as resistance.
Key Levels to Watch
Resistance Levels:
42,500 - 42,800 (Neckline resistance; sellers may defend this level)
43,200 - 44,000 (If price reclaims this zone, bearish structure invalidated)
Support Levels (Bearish Target Areas):
40,000 - 39,800 (Psychological support)
38,731 (Highlighted major target, where price could bounce)
37,600 (Next major demand zone if 38,731 fails)
Potential Scenarios
✅ Bearish Scenario (More Likely)
If price rejects 42,500, a continuation to 38,731 (-9.51%) is highly probable.
Volume is rising on declines, confirming strong selling pressure.
📈 Bullish Scenario (Less Likely)
If price closes above 42,800, we could see a short squeeze toward 44,000.
Conclusion
Overall Bias: Bearish
Confirmation Needed: Watch price action at 42,500-42,800—if rejected, expect a drop.
Ideal Trade Setup: Sell near 42,500 with a target at 38,731.

XAUUSD 1HFollowing the previous analysis ...
#DowJones Analysis
As long as 41825 holds, an upward move is expected with potential resistance at 42200.
The market movement is anticipated to follow the sketched schematic.

US30This is our View on US30, we do believe US30 will be playing around sideways before tapping close to 40K level and then will give us a buy setup for long term.
Disclosure: We are part of Trade Nation's Influencer program and receive a monthly fee for using their TradingView charts in our analysis.

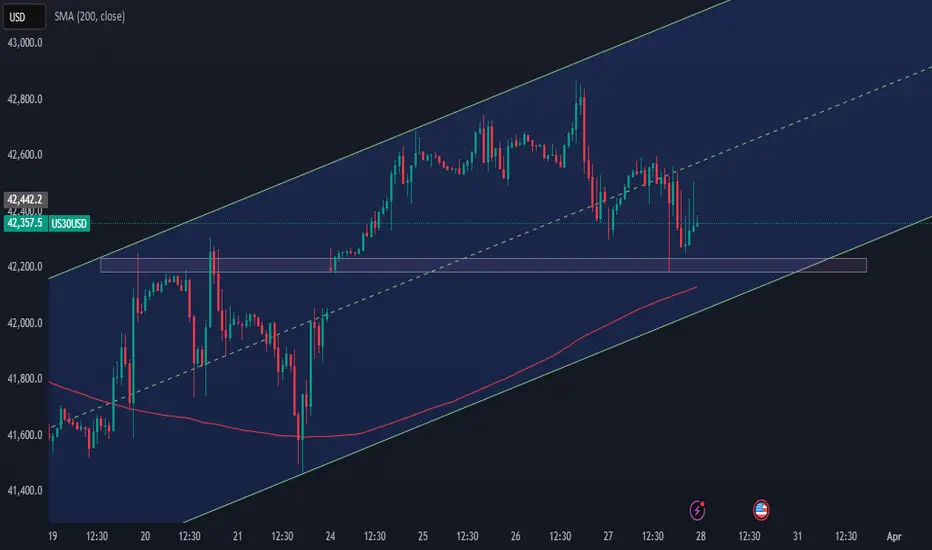
Dow Jones ChannelEverything seems ready for the climb.
On the one-hour timeframe, the 200 MA and the channel floor are ready to support the price, and a great rally is likely in store for the Dow Jones.
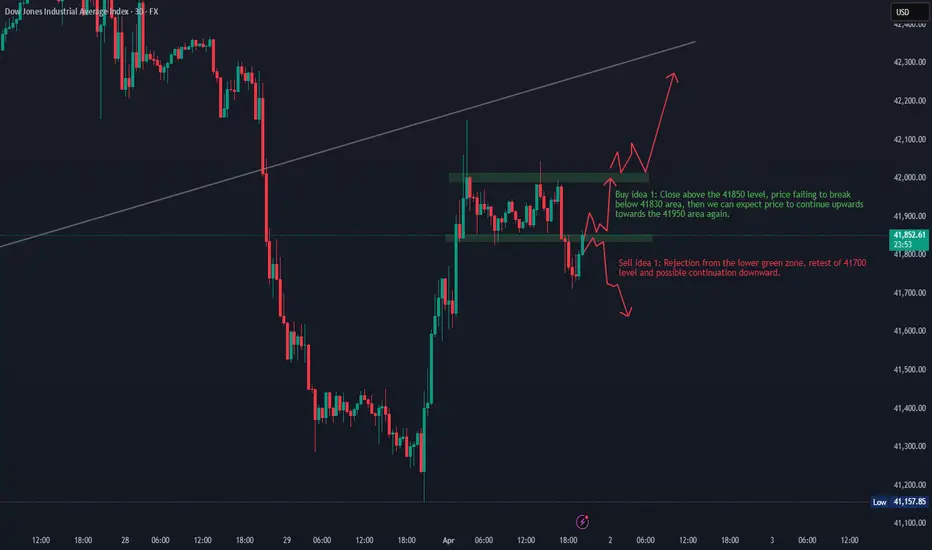
US30 Sells Idea for the New York SessionUnless we see some news come out on tariffs, we could see some downside on US30 today. It is falling inside a wedge pattern right now, and I expect the price action to fall within that wedge with a potential to go down during the New York session. I will be waiting for a break of the upper green zone (around 42150), then a pullback and rejection, to take sells down towards the 42000 (and possibly lower) areas.
I am not looking for any buys on US30 today, unless I see some really big green candles towards the upside during the 9:30 am EST.

DJIA H4 | Potential bullish bounceDJIA (US30) is falling towards a multi-swing-low support and could potentially bounce off this level to climb higher.
Buy entry is at 41,282.01 which is a multi-swing-low support that aligns close to the 78.6% Fibonacci retracement.
Stop loss is at 41,080.00 which is a level that lies underneath a multi-swing-low support and the 78.6% Fibonacci retracement.
Take profit is at 42,240.15 which is an overlap resistance that aligns with the 61.8% Fibonacci retracement.
High Risk Investment Warning
Trading Forex/CFDs on margin carries a high level of risk and may not be suitable for all investors. Leverage can work against you.
Stratos Markets Limited (www.fxcm.com):
CFDs are complex instruments and come with a high risk of losing money rapidly due to leverage. 63% of retail investor accounts lose money when trading CFDs with this provider. You should consider whether you understand how CFDs work and whether you can afford to take the high risk of losing your money.
Stratos Europe Ltd (www.fxcm.com):
CFDs are complex instruments and come with a high risk of losing money rapidly due to leverage. 63% of retail investor accounts lose money when trading CFDs with this provider. You should consider whether you understand how CFDs work and whether you can afford to take the high risk of losing your money.
Stratos Trading Pty. Limited (www.fxcm.com):
Trading FX/CFDs carries significant risks. FXCM AU (AFSL 309763), please read the Financial Services Guide, Product Disclosure Statement, Target Market Determination and Terms of Business at www.fxcm.com
Stratos Global LLC (www.fxcm.com):
Losses can exceed deposits.
Please be advised that the information presented on TradingView is provided to FXCM (‘Company’, ‘we’) by a third-party provider (‘TFA Global Pte Ltd’). Please be reminded that you are solely responsible for the trading decisions on your account. There is a very high degree of risk involved in trading. Any information and/or content is intended entirely for research, educational and informational purposes only and does not constitute investment or consultation advice or investment strategy. The information is not tailored to the investment needs of any specific person and therefore does not involve a consideration of any of the investment objectives, financial situation or needs of any viewer that may receive it. Kindly also note that past performance is not a reliable indicator of future results. Actual results may differ materially from those anticipated in forward-looking or past performance statements. We assume no liability as to the accuracy or completeness of any of the information and/or content provided herein and the Company cannot be held responsible for any omission, mistake nor for any loss or damage including without limitation to any loss of profit which may arise from reliance on any information supplied by TFA Global Pte Ltd.
The speaker(s) is neither an employee, agent nor representative of FXCM and is therefore acting independently. The opinions given are their own, constitute general market commentary, and do not constitute the opinion or advice of FXCM or any form of personal or investment advice. FXCM neither endorses nor guarantees offerings of third-party speakers, nor is FXCM responsible for the content, veracity or opinions of third-party speakers, presenters or participants.

US30 Trade Outlook – 31/03/2025🚨 US30 Trade Outlook – 31/03/2025 🚨
📊 Market Structure & Key Levels
US30 is currently consolidating after a steep selloff from the 42,800s. Price is sitting near short-term support at 41,434, but momentum remains bearish unless bulls step in fast.
🔍 Key Observations:
🔻 Strong Bearish Momentum – Sharp drop from resistance zones
🔹 Support Holding (for now): 41,400
🔻 Breakdown Risk: Below 41,400 opens the door toward 40,678
🎯 Trade Plan:
🔻 Short if 41,400 fails → Target 40,678
🔹 Long only if price reclaims 41,800+ and EMAs flip bullish
⚠️ Wait for clean confirmations – no chasing moves.

US30 Scalping Ideas for NYSE open todaySince the NYSE brings a lot of volume, we can look for both buy and sell ideas depending on how the candles behave. I will wait for the first 5-minute candle after the NYSE open to plan my trade.
Higher timeframes (weekly, 4H, and the hourly) all look bearish except for the bullish close yesterday, so my bias is still bearish. Unless we see some tariff related good news or any other fundamental news release, the continuation most likely can be towards the downside.
Happy trading!
NOT TAGGED US30This setup was seen because of the resting highs spotted on the discussion dropped before this one, and the 15 m gap left as the market rose within the mids, I am not yet tagged but I am not on the rush to being tagged because the plan is a gap, zone, breaker block, premium price, and they all tick, if it does not, well well well, this will be just another day, no rush.
Happy Trading
