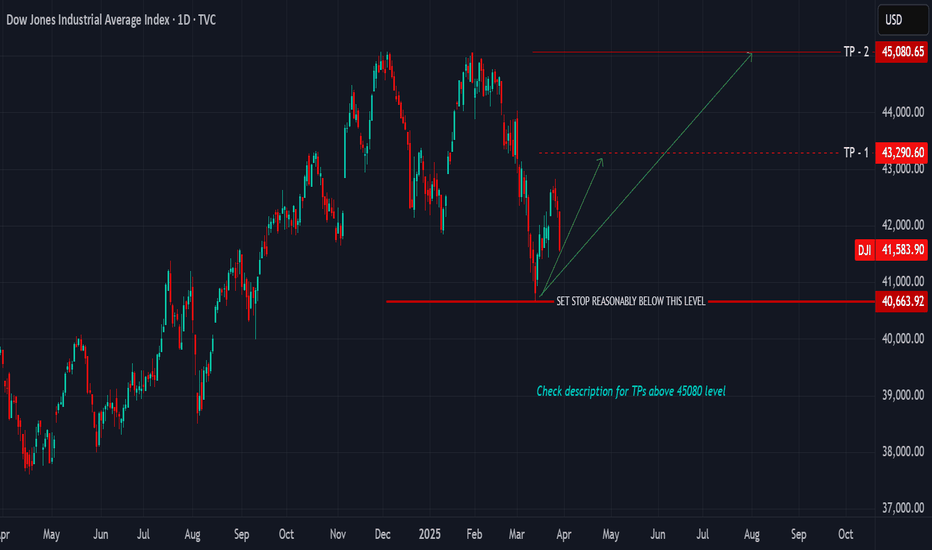
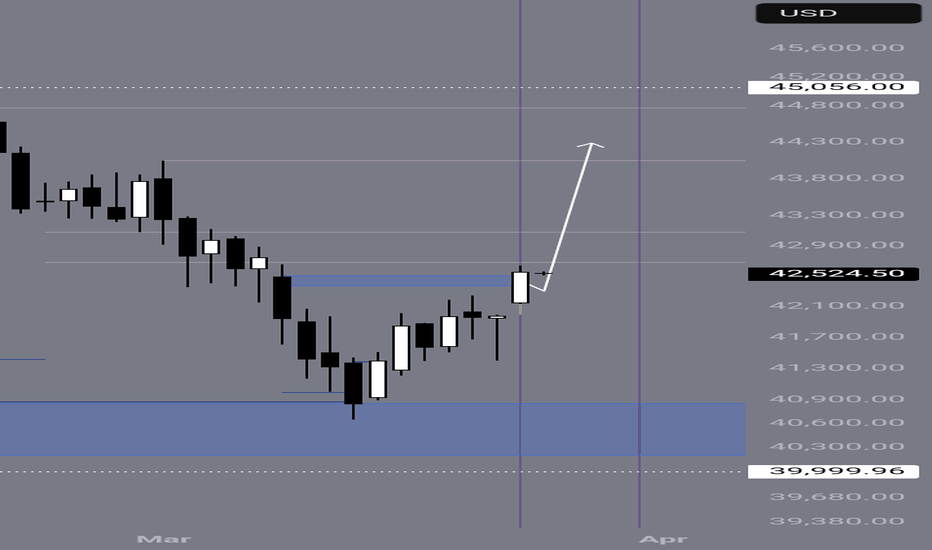
BUY EVERY DIP, HOLD FOR THE NEXT 7-MONTH CYCLE UNTIL OCTOBERThere are the current turmoil by tariffs and perceived recession, yet, the cycles strongly support a further advance from the March lows until October 2025. The bottom in March 2020 formed the base for the 5 year bull cycle nested within the larger 13 year cycle.
PRICE
The 2020 crash low formed at 18213.65, the decline in 2022 formed a bottom at 28660.94. We would have a price range Low - Low of (+10447.29 pts)
(28660.94 - 18213.65) = 10447.29 units
By projection if the range between the first two bottoms is 10447.29 we would expect the third bottom connecting three expanding points to be at 1.618 of 10447.29 points from 28660.94
28660.94 + (10447.29 x 1.618) = 45564.66
This makes the current top at 45073.63 through 45564.66 level a major support whereas its also a minor resistance for some correction and we expect price to move through this level.
TIME
Time connecting the three points 23/03/2020 - 03/01/2022 - 10/10/2022 with March 2020 as starting point would give us a time count (0.0 - 651 days - 931 days).
We find that between the two bottoms the top in Jan 2022 came in at 651 days. By projection we expect the next bottom to be at least 209 weeks or 1463 days from 10/10/2022 with a top located at a Phi variation of 651.
We would project a time range 1064 - 1099 days for a top and a decline into the third bottom 1463 days from 10/10/2022 and 2394 days from 23/03/2020. Trade safe, good luck.
US30 trade ideas
warning dji huge correction incomingThis is whats going on,Trumps tariffs are a catalyst for whats happening.we are going back down to the 0.618 level and are in an abc correction at this time, a 3 month bearish Div on the macd,also,we only have seen dji only down 2+ percent and people are freaking out about there 401k and how the richer are going to get richer by buying this dip. i agree if you have no free cash you are stuck. if this plays out its going to be painful,but after this correction we will be shooting vertical,and is your best opportunity to buy low and get rich.
sellPlease provide a meaningful and detailed description of your analysis and prediction. Walk us through your thought process. Put yourself in the reader’s shoes and see if you would understand the context based on what you wrote. Clearly stated profit targets and stop loss areas help clarify any trade idea.
DJI US stock market forecast 2025-2026Assumption:
oct-22 — nov-24 (1-2-3-4-5) wave is over.
correction (a)-(b)-(c) is expected.
likely structure is a 3 wave regular flat.
Time:
the correction is expected to last until at least sep-25.
Price:
it's too early to predict final price for wave (c).
anticipated range is 35000-39000.
wave (a) shall reach 39600.
Long term waves:
Major uptrend lasts 25 years.
Major correcting downtrend lasts 9 years.
Next major downtrend is expected to start in 2033-2034.
US30 Trade Outlook – 28/03/2025 🚨 US30 Trade Outlook – 28/03/2025 🚨
📊 Market Structure & Key Levels
US30 is holding just above key support at 42,159, after a sharp rejection from the 42,787 - 42,872 resistance zone. Current price action suggests potential for a breakdown if buyers don’t step in.
🔍 Key Observations:
🔻 Bearish Pressure – Lower highs forming + rejection from supply
🔹 Critical Support: 42,159
🔻 Break below = downtrend continuation
🔹 If held = range/reversal potential
🎯 Trade Plan:
🔻 Short below 42,159 → Target 41,529 – 41,462
🔹 Long only if strong bounce above EMAs & 42,400 reclaimed
⚡️ Let the level guide you. Stay disciplined.
Support and resistance: navigating all-time highs with US 30Trading the US30 (Dow Jones Industrial Average) with support and resistance is a powerful strategy, especially when the index approaches or breaks into all-time highs (ATHs). Key support levels often form at previous resistance zones, while psychological price levels (like round numbers) can act as both barriers and breakout points. When US30 reaches new ATHs, traditional resistance no longer exists, so traders must rely on Fibonacci extensions, trendlines, and volume analysis to gauge momentum. Watching price action near key levels and using stop-loss strategies can help manage risk in these uncharted territories. Always stay adaptable—ATH breakouts can lead to explosive rallies, but false breakouts are just as common.
US30 longHere is why:
All the timeframes (3M, M,W and D) are showing very bullish signs after the recent downfall we have seen in price due to political factors. However, there is no clear targets in those timeframes as of now.
However, there is a distinct target on the 4H timeframe.
The target is at 42,980.
The reason is we saw price collecting a lot of orders at 41,500 and the next major liquidity point is at 42,980.
So basically, all price is doing is collecting orders in order to reach that target.
We know this to be true because we have seen bullish indications in the way price has been collecting orders between the consolidation region of 42,660 and 42,500.
Yesterday, price broke above that region, however, orders that were made at the time were not enough for price to reach the target of 42,980.
Price went all the way to 42,300 to collect more orders in order to go and hit the 42,980 liquidity region.
Currently, I am waiting for price to form any sort of bullish confirmation for me to buy.
The best signs for that is for price to retrace to 42,500, where I will look to buy to the next liquidity region at 42,650.
Trade Idea: US30 Long ( BUY LIMIT ) Technical Analysis:
1. Daily Chart (Long-Term View):
• The price has recently pulled back but remains in a long-term uptrend.
• The MACD is negative, indicating past selling pressure, but it is starting to turn, which suggests momentum may shift bullish.
• The RSI is at 47.54, close to neutral, meaning there is room for upside movement without being overbought.
2. 15-Minute Chart (Intraday Trend):
• The price is recovering after a dip.
• MACD is deeply negative, suggesting it may be at a bottom, and a reversal could happen.
• The RSI at 48.27 is near neutral, indicating a potential bullish move.
3. 3-Minute Chart (Entry Timing):
• A small uptrend has started, and the price is crossing above the short-term moving average.
• The MACD is turning positive, signaling a potential bullish push.
• RSI is above 50 (56.24), confirming strength in the short term.
⸻
Fundamental Analysis:
• Market sentiment remains bullish overall for US indices due to strong economic data.
• Dow Jones remains in an uptrend on the higher timeframes, and recent dips are likely just corrections before another push higher.
• Liquidity conditions and central bank policy support equities.
⸻
Trade Setup:
Entry: 42,400 (current price area where price is stabilizing)
Stop Loss (SL): 42,250 (below recent support, keeping risk low)
Take Profit (TP): 42,800 (previous resistance level) FUSIONMARKETS:US30
SELL TO GAP IN MARKETOn the 24th of March, there was a gap in the market. This gap needs to be filled in the near future. Fortunately for today, the upward movement has to an for now. Which signaling, the possibility that GAP will be filled soon. Given the recent drop in price from today's highest price, down to 42500. This price level is also a support level on the 25th of March. Price will definitely drop to 42000.
Dow Jones INTRADAY awaits US Consumer Confidence dataThe Consumer Confidence Index, set to be released today at 14:00 GMT by the Conference Board, measures consumer sentiment on spending, jobs, inflation, and the economy. Since consumer spending drives the U.S. economy, a strong reading can signal bullish momentum for equities, while a weak reading may indicate bearish sentiment. Traders watch this data closely for insights into market direction.
Key Support and Resistance Levels
Resistance Level 1: 42847
Resistance Level 2: 43162
Resistance Level 3: 43442
Support Level 1: 41828
Support Level 2: 41400
Support Level 3: 40687
This communication is for informational purposes only and should not be viewed as any form of recommendation as to a particular course of action or as investment advice. It is not intended as an offer or solicitation for the purchase or sale of any financial instrument or as an official confirmation of any transaction. Opinions, estimates and assumptions expressed herein are made as of the date of this communication and are subject to change without notice. This communication has been prepared based upon information, including market prices, data and other information, believed to be reliable; however, Trade Nation does not warrant its completeness or accuracy. All market prices and market data contained in or attached to this communication are indicative and subject to change without notice.
US30 Market Outlook – 25/03/2025🚨 US30 Market Outlook – 25/03/2025 🚨
📊 Structure Overview
US30 continues its bullish climb, now trading near a key resistance zone at 42,631. The recent rally from the 41,460 - 41,530 support zone has been strong, but momentum is slowing near this resistance.
🔍 Key Observations:
✅ Bullish Momentum – Price riding above EMAs with clean higher highs/lows.
✅ Major Resistance – Sitting just under 42,631, with the next levels at 42,787 - 43,021.
✅ Support Zone – Strong demand seen around 41,460 - 41,530, which sparked the current rally.
🎯 Trade Scenarios:
🔹 Bullish Bias if price breaks & holds above 42,631, targeting 42,787 - 43,021.
🔻 Bearish Pullback possible if rejection at current level, with potential drop to 42,100 - 41,800.
📌 Outlook Summary:
US30 remains bullish, but extended. Watch for either a clean breakout above resistance or a pullback to key support. Volume and structure will confirm the next move.


