US30 trade ideas
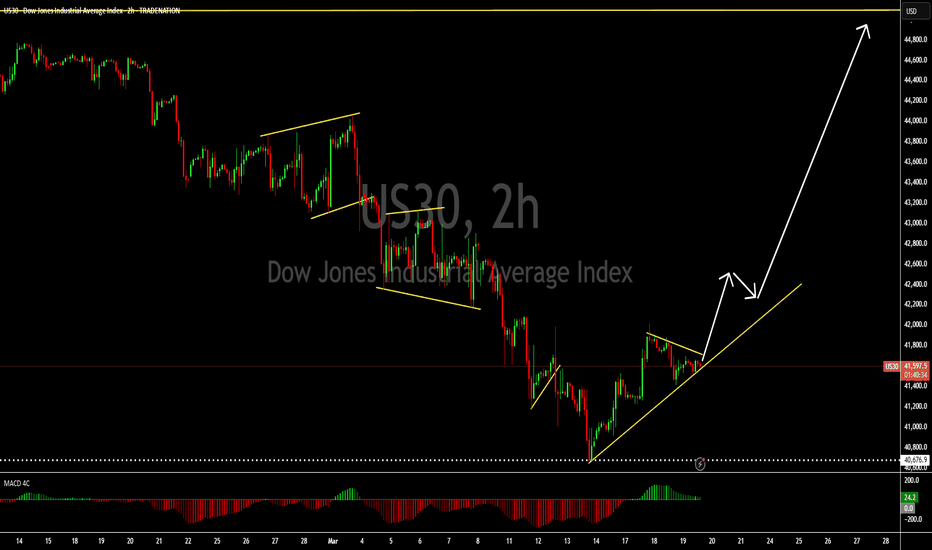
Bearish outlook, followed by a bullish longUS30 broke through a bearish channel last week and has continued to show bullish pressure. However, as long as the price is under 42,000, the indice may correct a bit, towards the 41,550, 41,200, and 41,000 barriers.
Price action is currently oscillating between 42,000 and 40,600. A break of either side, will be the intended direction from a long term perspective.
DowJones INTRADAY Volatility ahead Fed Rate decisionAs the Federal Reserve wraps up its two-day meeting today, investors will be paying close attention to Chair Jerome Powell’s comments, as they could spark market volatility.
Although Powell recently stated that “the economy’s fine,” traders will closely examine his remarks and the updated forecasts (the dot plot) for any signs of concern. The Fed’s projections are expected to show slower economic growth while acknowledging persistent inflation. Typically, the Fed waits for clear changes in the data before taking more decisive action.
Key Support and Resistance Levels
Resistance Level 1: 42488
Resistance Level 2: 43067
Resistance Level 3: 43575
Support Level 1: 40657
Support Level 2: 40109
Support Level 3: 39584
This communication is for informational purposes only and should not be viewed as any form of recommendation as to a particular course of action or as investment advice. It is not intended as an offer or solicitation for the purchase or sale of any financial instrument or as an official confirmation of any transaction. Opinions, estimates and assumptions expressed herein are made as of the date of this communication and are subject to change without notice. This communication has been prepared based upon information, including market prices, data and other information, believed to be reliable; however, Trade Nation does not warrant its completeness or accuracy. All market prices and market data contained in or attached to this communication are indicative and subject to change without notice.
Buy the dip: US30 (Dow Jones industrial average Index)Hello,
The stock market remains a compelling investment option despite a two-month correction. Recently, U.S. equities have experienced heightened volatility as investors navigate the uncertainties surrounding trade tariffs and regulatory policies. President Trump’s unpredictable stance—announcing tariffs only to retract them at the last minute—has added to market instability, making it challenging for businesses to plan with confidence.
While many analysts anticipated higher inflation due to tariffs, deregulation, and deportations, the combination of a declining stock market and falling interest rates suggests a potential deflationary environment. Given these conditions, Federal Reserve Chair Jerome Powell has signaled a cautious stance, acknowledging that inflation remains contained. However, if fears of an economic slowdown driven by trade tensions escalate, the Fed may implement the first of a series of rapid rate cuts as early as June.
The next Federal Reserve rate decision is scheduled for today March 19, 2025. As shown in the chart here
The stock market has remained resilient over the long term always recovering from corrections and achieving new highs. Since the current president (Trump) is pro markets, we expect the same trend to continue over the long run. This can be reinforced by the fact that he has gone to an extent of buying a Tesla car in support of Tesla company owned by Musk. At the right time, Trump or the FED shall move to save the stock market from a crash.
Disclosure: I am part of Trade Nation's Influencer program and receive a monthly fee for using their TradingView charts in my analysis.
DOW JONES This is why chances of a brutal rebound are so high.Dow Jones (DJIA) has been trading within a Channel Up since the July 31 2023 High and last week it hit (marginally breached) its 1W MA50 (blue trend-line) for the first time since the week of October 30 2023. The price went on to test the bottom of the Channel Up and rebounded back above the 1W MA50.
This is an incredibly strong long-term bullish signal and it is not the only one. The market also made a Lower Low rebound on the 3-month trend-line while the 1W CCI got oversold below -150.00 and is rebounding. The last time we got these conditions fulfilled was exactly 2 years ago on the March 13 2023 Low.
That was when the index made a similar Megaphone Lower Low rebound on oversold 1W CCI that initiated a +13.57% rally. Both Megaphone fractals emerged after Dow rose by +21.00%.
In fact, every oversold 1W CCI rebound has produced very aggressive rallies. Based on those similarities with the March 2023 fractal, we expect the index to hit 46150 (+13.57%) minimum by July. If the more aggressive scenario of the November 25 2024 rally that made a Channel Up Higher High on the 1.5 Fibonacci extension prevails, then our more optimistic scenario is 48900 (Target 2) by September, which could technically be the end/ Top of the current Bull Cycle.
-------------------------------------------------------------------------------
** Please LIKE 👍, FOLLOW ✅, SHARE 🙌 and COMMENT ✍ if you enjoy this idea! Also share your ideas and charts in the comments section below! This is best way to keep it relevant, support us, keep the content here free and allow the idea to reach as many people as possible. **
-------------------------------------------------------------------------------
Disclosure: I am part of Trade Nation's Influencer program and receive a monthly fee for using their TradingView charts in my analysis.
💸💸💸💸💸💸
👇 👇 👇 👇 👇 👇
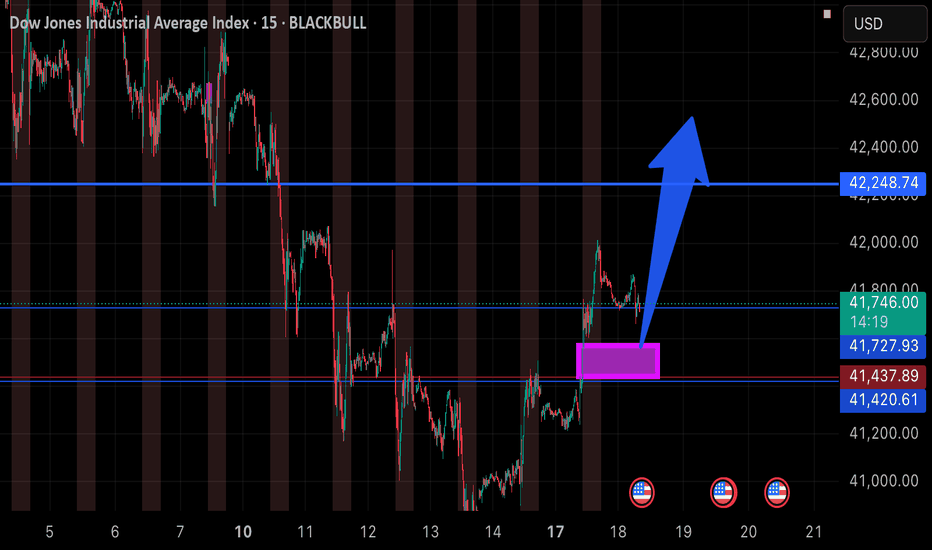
Order Block @41484 |Buy signalPrice created a break of structure that was preceded by an order block and fair value gap.
It then retraced to mitigate the fair value gap, it then created a change of character on the fair value gap which was a confirmation for the buy signal. Entry will be on the order block that created the change of character, targeting the next swing high.
DOW JOUNES DOWNDOW JOUNES DOWN
It seems you're curious about Dow Jones Index and its future trends. Based on recent forecasts, the Dow Jones Industrial Average (DJIA) is expected to fluctuate within certain ranges over the coming days. For example, predictions for March 19th suggest a range between 37,549 and 43,201, with an average value of 40,375. Keep in mind that market conditions can change rapidly, so these are just projections.
US30 Is Bullish! Buy!
Take a look at our analysis for US30.
Time Frame: 10h
Current Trend: Bullish
Sentiment: Oversold (based on 7-period RSI)
Forecast: Bullish
The market is on a crucial zone of demand 41,762.6.
The oversold market condition in a combination with key structure gives us a relatively strong bullish signal with goal 43,373.5 level.
P.S
Please, note that an oversold/overbought condition can last for a long time, and therefore being oversold/overbought doesn't mean a price rally will come soon, or at all.
Disclosure: I am part of Trade Nation's Influencer program and receive a monthly fee for using their TradingView charts in my analysis.
Like and subscribe and comment my ideas if you enjoy them!
DOW JONES INDEX (US30): Pullback From Resistance
Dow Jones Index looks bearish after a test of a key daily/intraday resistance.
An inverted cup & handle pattern on that on an hourly and a strong
intraday bearish momentum this morning leaves clear bearish clues.
I think that the market can retrace at least to 41580 support.
❤️Please, support my work with like, thank you!❤️
US30 Trade Outlook – 18/03/2025 🚨 US30 Trade Outlook – 18/03/2025 🚨
📊 Market Structure & Key Levels
US30 has seen a strong bullish push but is now facing resistance at 41,969. The price is consolidating near this level, indicating a potential breakout or rejection scenario.
🔍 Key Observations:
✅ Bullish Momentum – Price broke above EMAs and is holding higher lows.
✅ Key Resistance – 41,969 - 42,000 is a major level to watch.
✅ Support Zone – 41,600 is the key area for buyers to defend.
🎯 Trade Plan:
🔹 Long if price breaks & retests 41,969, targeting 42,200 - 42,600.
🔻 Short if rejection at 41,969, targeting 41,600 - 41,400.
⚡ Watch for confirmations & manage risk! 🔥
Fundamental Analysis of Tariffs and Donald Trump/ Herbert HooverHerbert Hoover and Donald Trump are very similar in their policies. Both are Republicans that want to impose high tariffs. I believe the market is seeing past history and are bracing.
Looking at the timeline of the 1929 Depression, which Hoover caused due to his tariffs, I am seeing similar action today. I don't know if a wide spread depression will hit again but it is quite funny that we are rapidly approaching the 100 year anniversary of the 1929 Crash (2029). Both times had a Republican president, a Republican controlled House and Senate, High Tariffs. It seems like history does have a way of repeating itself.
I too am bracing for the last rally to 46,000 before something may happen. I don't know if anything will or not. Key levels to watch for is a massive slice through 41,000 marked in red, a pullback into the bottom and a downtrend reversal. This is on the weekly chart and so, price action takes time to unfold.


