NAS100 Buy Trade Analysis (4H Timeframe)Entered a buy position on NAS100 after price retraced to the 0.618 Fibonacci level, which also aligns perfectly with the ascending trendline support. This area has acted as a strong confluence zone, showing signs of a potential higher low (HL) formation on the 4H chart.
✅ Confluences supporting the
Nasdaq - Printing The Obvious Bottom!Nasdaq ( TVC:NDQ ) already finished the correction:
Click chart above to see the detailed analysis👆🏻
After we witnessed a minor "crash" of about -25% over the past couple of weeks, the bottom might be in on the Nasdaq. We simply saw another very bullish all time high break and retest and depi
Nasdaq 100 - Bull trap print begins circa April 30thThe Nasdaq 100 index is seriously oversold as market participants are gripped by fear. Understandable… however, markets do not crash in fear. Instead the opposite happens, counterintuitive as that sounds.
The Index shall continue display volatility until sellers are exhausted, which is around April
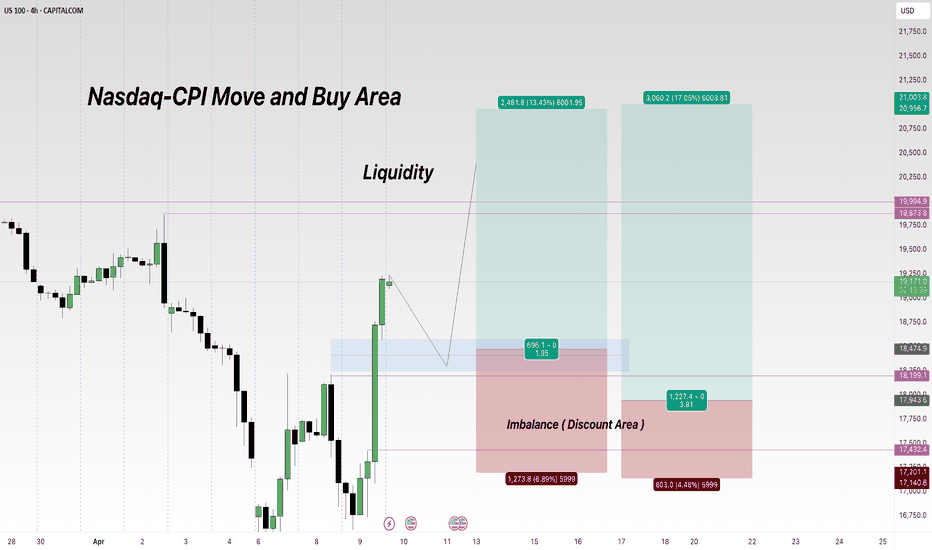
Will Nasdaq Test Liquidity at 17,800 Before an Upside Move?NASDAQ is experiencing bearish slow down at the support level for the past 3 weeks. A re-test of the recent low looks imminent. and if price could be rejected after clearing H4 liquidity at 17,800, then we could see a sharp upside move.
Key risks: Fed commentary, major tech earnings, and geopolit
Nasdaq - This Is Still Not The End Yet!Nasdaq ( TVC:NDQ ) cannot resist bearish pressure:
Click chart above to see the detailed analysis👆🏻
Over the past three months, we saw such a harsh correction on the Nasdaq that a lot of people are freaking out entirely. However technicals already told us that something feels wrong and this i
NASDAQ: Stop the noise. Long term investors are buying here.Nasdaq may be recovering on its 1D technical outlook but remains bearish on the 1W (RSI = 37.616, MACD = -451.790, ADX = 38.564) as the timeframe is still under the dramatic effect of the 3 month correction. The market however appears to be finding support a little over the 1W MA200 and may turn out
US100 - Lots of opportunities unfoldingChart Overview:
This analysis focuses on the US 100 (NAS100) index, sourced from CAPITAL.COM . The chart highlights critical price levels, Fair Value Gaps (FVGs) , and a Buy side liquidity (BSL) , offering actionable insights for traders.
Key Observations:
1. Price Action & Structure
WHERE TO GO....NDXGood Morning,
I entered a trade with QQQ yesterday as the market has signaled a strong movement for the bulls. By no means is this a confirmed moved however I saw an opportunity for early entry.
We still need to beat out the overall trend reversal resistance which is at the 19,700 mark of April
Hanzo | Nas100 15 min Breaks – Will Confirm the Next Move🆚 Nas100 – Hanzo’s Strike Setup
🔥 Timeframe: 15-Minute (15M)
———————
💯 Main Focus: Bullish Breakout at 18030
We are watching this zone closely.
📌 If price breaks with high volume, it confirms Smart Money is in control, and a strong move may follow.
💯 Main Focus: Bearish Breakout at 17830
We are wa
See all ideas
Displays a symbol's price movements over previous years to identify recurring trends.


