Buy Nasdaq - Candle stick CONFIRMED BUYERS are in control....
- broke through our STRONG RESISTANCE... bearish trend....
Buys Nasdaq.
USTEC trade ideas

FOR SCAPLER THATS A SHORT USTECHThemakert is showing a rejection on that trendline so wait in 1 Hour if that candlestic closes a revesal candlestic GO Short to cover The Gap

WHERE TO GO....NDXGood Morning,
I entered a trade with QQQ yesterday as the market has signaled a strong movement for the bulls. By no means is this a confirmed moved however I saw an opportunity for early entry.
We still need to beat out the overall trend reversal resistance which is at the 19,700 mark of April 2th.
Prior to that we need to make it through:
18,400$ First resistance.
19,000 2nd Resistance.
Trend is showing that we will break both of those levels.
Enjoy!

X2: NQ/US100/NAS100 Short - Day Trades 1:2 RRX2:
Risking 1% to make 2%
NAS100, US100, NQ, NASDAQ short for day trade, with my back testing of this strategy, it hits multiple possible take profits, manage your position accordingly.
Risking 1% to make 2%
Use proper risk management
Looks like good trade.
Lets monitor.
Use proper risk management.
Disclaimer: only idea, not advice

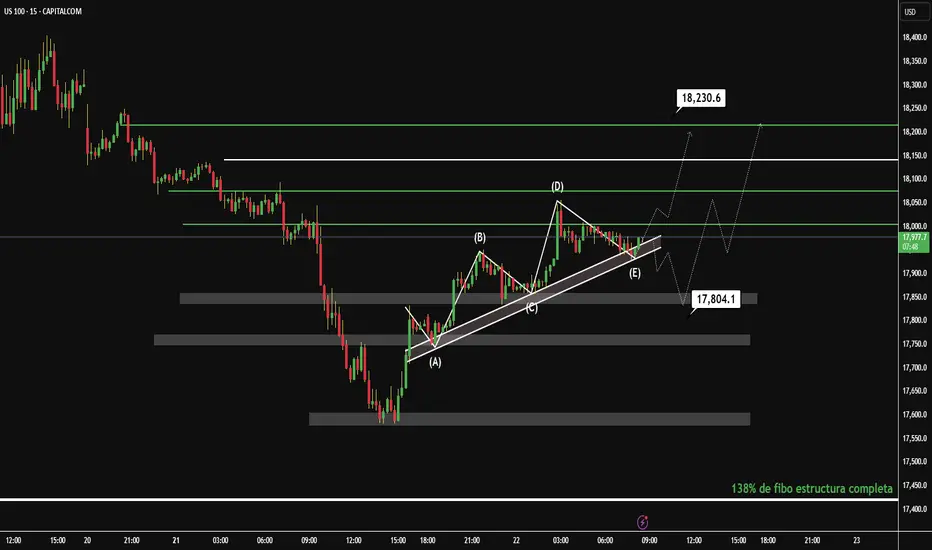
Ready for Takeoff: Buy Signal DetectedThe 15-minute chart of the NASDAQ shows a recent bullish move following a correction. I identify an interesting technical structure that could indicate an upcoming directional move.
Technical Analysis:
Patterns and Structure:
Symmetrical Triangle (A): The price has formed a symmetrical triangle between points (B) and (D), suggesting consolidation before a breakout. This pattern is neutral, but the recent upside breakout indicates a possible bullish continuation.
Fibonacci: The retracement from the high at (D) to the low at (E) reached the 38.2% Fibonacci level, which acted as dynamic support (17,804.1). This level is key and reinforces the validity of the current rebound.
Support and Resistance:
Support: The 17,804.1 level (38.2% Fibonacci) and the triangle base at 17,797.2 are key supports.
Resistance: The next upside target is at 18,230.6, a previous resistance level. If the price breaks above it, it could target 18,400.
Trend:
The breakout of the symmetrical triangle and the rebound from the 38.2% Fib confirm a short-term uptrend. The price is breaking the triangle's downtrend line (E), reinforcing the bullish momentum.
Trading Idea:
Entry: Consider a long entry (buy) at the current level (~18,000) or wait for a pullback to the support at 17,804.1 for a better risk-reward ratio.
Target: First target at 18,230.6 (resistance). If the momentum continues, the next level to watch is 18,400.
Stop Loss: Below the support at 17,797.2, to protect against a false breakout.
Risk/Reward: An entry at 18,000 with a stop at 17,797 and a target at 18,230 offers an R/B ratio of approximately 1:1.2.
Conclusion:
The NASDAQ at 15M shows a bullish breakout following a symmetrical triangle, with support at the 38.2% Fibonacci level. The short-term trend is bullish, with an initial target at 18,230.6. Monitor support at 17,804.1 to confirm the continuation of the move.
This analysis is concise and structured for a TradingView post. If you need adjustments or more details, please let me know.
Disclaimer: Grok is not a financial advisor; please consult one. Do not share information that could identify you.
ANALYSE NASDAK US 100now nasdak to way to finish first wave forentre now we need corection nasdak now more 8300 point like and follow our profile for more analyse forex crypto stocks future any help just inbox me our write comment and good luck

Hanzo | Nas100 15 min Breaks – Will Confirm the Next Move🆚 Nas100 – Hanzo’s Strike Setup
🔥 Timeframe: 15-Minute (15M)
———————
💯 Main Focus: Bullish Breakout at 18030
We are watching this zone closely.
📌 If price breaks with high volume, it confirms Smart Money is in control, and a strong move may follow.
💯 Main Focus: Bearish Breakout at 17830
We are watching this zone closely.
📌 If price breaks with high volume, it confirms Smart Money is in control, and a strong move may follow.
———
🔻 Every warrior needs a tribe.
Follow Hanzo. Support the path.
Analysis
👌 Bearish Signs (15M TF):
• Liquidity Grab + CHoCH at 18700
• Liquidity Grab + CHoCH at 18400
• Strong Rejections seen at:
➗ 18400 – Major support
➗ 19000 – Proven resistance
———
🩸 Key Zones to Watch:
• 18700 – Bearish breakout level
• 19130 – Strong resistance (tested 6 times)
• 18400 – Equal lows
Hanzo | Nas100 15 min Breaks – Will Confirm the Next Move

NAS100USD: Bearish Bias Expected to Hold After RetracementGreetings Traders!
In today’s analysis of NAS100USD, we maintain a bearish outlook despite short-term bullish movements in price action. These bullish signs appear to be corrective and in alignment with institutional objectives to rebalance inefficiencies created during yesterday’s sharp decline.
KEY OBSERVATIONS:
1. Inefficiency Rebalancing Completed:
Price has retraced to fill fair value gaps left behind by recent downside volatility. With those inefficiencies now rebalanced, we anticipate a continuation of the dominant bearish institutional order flow.
2. Buy Stops Taken – Institutional Order Pairing:
The sweep of buy stops confirms liquidity collection for institutional sell-side positioning. This aligns with a classic distribution phase, where institutions utilize buy-side liquidity to enter short positions.
3. Institutional Resistance – Rejection Block:
Price is currently reacting at a key institutional resistance zone, known as the rejection block. This zone, formed prior to the latest downside move, may act as the final area of resistance before renewed bearish continuation.
TRADING PLAN:
Entry Consideration:
Monitor price behavior at the rejection block. Upon confirmation, this area offers a high-probability setup for short entries.
Profit Targets:
Focus on targeting liquidity pools resting at deeper discount levels. These areas represent logical destinations for price based on institutional order flow dynamics.
Remain diligent and patient in your execution. Let the market confirm the direction before committing to a position.
Kind Regards,
The Architect

Nasdaq 100 (US100) – Bearish Double Top PatternNasdaq 100 shows a clear Double Top pattern, signaling a potential bearish reversal after recent bullish momentum. Price has broken below the neckline, confirming the pattern, and is now heading toward the projected target around 16,500.
Fundamentally, risk sentiment remains shaky amid rising interest rate expectations and mixed earnings reports, adding pressure to tech-heavy indices like US100.
Pattern: Double Top
Bias: Bearish
Target: 16,500
Resistance: 18,000+
Trade Active: Short bias below neckline level
NOTE: This is not financial advice. Trade at your own risk.
Support: Like & follow for more trade ideas!

US 100 Index - Is 17404/749 Support Important?As European traders return from their extended Easter break they turn on their screens to find US assets back under pressure. The US 100 index dropped 2.2% yesterday to close at 17779, which included a late rally from a mid session low at 17570.
These moves are potentially reflecting a growing unease around numerous important issues, including, a lack of progress in trade talks with US allies, US economic growth concerns and President Trump's on-going challenge to Federal Reserve independence.
Looking forward, US 100 traders have a lot to focus on this week, Tesla reports its earnings after the close tonight, against a backdrop of weekend news reports which suggested it may be about to delay production of cheaper EVs. That aside, investors may also be focused on sales projections for 2025, autonomous driving plans and the impact of tariffs on the company's profitability.
It may well be a similar story when Alphabet reports its earnings after the close on Thursday.
Throw in the latest April Preliminary PMI Survey releases on Wednesday from the developed economies, which could well start to show the impact of tariffs on growth, business sentiment and inflation, and it is possible that the recent US 100 index volatility could continue across the week.
Technical Update: Could Potential Support at 17404/17749 Be Important?
As impressive as the 18% recovery in the US 100 index from the April 7th 2025 low to the April 10th 2025 high (16290 up to 19222) appeared, after the latest price weakness, this upside may prove to be a limited reactive move, although further confirmation may still be required.
As the chart above shows, the latest upside strength saw the index back to what some traders may have viewed as an important resistance, marked by a combination of the declining Bollinger mid-average (18992 at the time) and the 50% Fibonacci retracement of the February 18th 2025 to April 7th 2025 weakness, which stands at 19258.
With the latest price activity seeing weakness materialise again, it might now be suggested
this potential resistance range remains the important focus on the topside, although much will depend on future market sentiment and price trends.
With this in mind, what are the potential supports we might wish to monitor, to help us gauge how much further the current weakness may have to carry?
Possible Support Levels:
Fibonacci retracements can offer an insight into potential support zones, with them possibly able to hold, even reverse price weakness back to the upside. Therefore, 17404/17749, which is equal to the 50% and 61.8% Fibonacci retracements of the April price strength, maybe an area traders are currently focusing on.
However, there could still be potential for a further period of price weakness if this 17404/17749 range is broken on a closing basis. In that case, the next support may well then be represented by the April 7th 2025 session low at 16290, possibly further, if this in turn gives way.
Possible Resistance Levels:
The 17404/17749 support range is still intact, and while this remains the case on a closing basis, attempts at price strength could still be seen. However, with the declining Bollinger mid-average currently at 18648 and having recently seen it reverse attempts at price strength, closing breaks above this level might be required to trigger a more extended phase of strength.
That said, as proved the case in early April, 19258, the 50% Fibonacci retracement level, may also now need to give way on a closing basis, to suggest further attempts to develop price strength towards higher resistance levels.
The material provided here has not been prepared in accordance with legal requirements designed to promote the independence of investment research and as such is considered to be a marketing communication. Whilst it is not subject to any prohibition on dealing ahead of the dissemination of investment research, we will not seek to take any advantage before providing it to our clients.
Pepperstone doesn’t represent that the material provided here is accurate, current or complete, and therefore shouldn’t be relied upon as such. The information, whether from a third party or not, isn’t to be considered as a recommendation; or an offer to buy or sell; or the solicitation of an offer to buy or sell any security, financial product or instrument; or to participate in any particular trading strategy. It does not take into account readers’ financial situation or investment objectives. We advise any readers of this content to seek their own advice. Without the approval of Pepperstone, reproduction or redistribution of this information isn’t permitted.

Eyes on US1001. Took out previous high
2. Change of delivery
3. SELL Limit in place
4. TP @ previous low.
Thoughts?

Nasdaq-100 H4 | Potential bearish reversalThe Nasdaq-100 (NAS100) could rise towards an overlap resistance and potentially reverse off this level to drop lower.
Sell entry is at 18,144.20 which is an overlap resistance.
Stop loss is at 18,800.00 which is a level that sits above an overlap resistance.
Take profit is at 16,779.34 which is a swing-low support.
High Risk Investment Warning
Trading Forex/CFDs on margin carries a high level of risk and may not be suitable for all investors. Leverage can work against you.
Stratos Markets Limited (tradu.com):
CFDs are complex instruments and come with a high risk of losing money rapidly due to leverage. 63% of retail investor accounts lose money when trading CFDs with this provider. You should consider whether you understand how CFDs work and whether you can afford to take the high risk of losing your money.
Stratos Europe Ltd (tradu.com):
CFDs are complex instruments and come with a high risk of losing money rapidly due to leverage. 63% of retail investor accounts lose money when trading CFDs with this provider. You should consider whether you understand how CFDs work and whether you can afford to take the high risk of losing your money.
Stratos Global LLC (tradu.com):
Losses can exceed deposits.
Please be advised that the information presented on TradingView is provided to Tradu (‘Company’, ‘we’) by a third-party provider (‘TFA Global Pte Ltd’). Please be reminded that you are solely responsible for the trading decisions on your account. There is a very high degree of risk involved in trading. Any information and/or content is intended entirely for research, educational and informational purposes only and does not constitute investment or consultation advice or investment strategy. The information is not tailored to the investment needs of any specific person and therefore does not involve a consideration of any of the investment objectives, financial situation or needs of any viewer that may receive it. Kindly also note that past performance is not a reliable indicator of future results. Actual results may differ materially from those anticipated in forward-looking or past performance statements. We assume no liability as to the accuracy or completeness of any of the information and/or content provided herein and the Company cannot be held responsible for any omission, mistake nor for any loss or damage including without limitation to any loss of profit which may arise from reliance on any information supplied by TFA Global Pte Ltd.
The speaker(s) is neither an employee, agent nor representative of Tradu and is therefore acting independently. The opinions given are their own, constitute general market commentary, and do not constitute the opinion or advice of Tradu or any form of personal or investment advice. Tradu neither endorses nor guarantees offerings of third-party speakers, nor is Tradu responsible for the content, veracity or opinions of third-party speakers, presenters or participants.

NAS100 BUY NOW!!!!!!!!!!Nas took out the buyside liquidity currently we looking at the price making a pull back or a retest to the buyside for a big rally up 19,107 is my target on nas am in on buy right now.....


today igot 1:650 RR trade in #nas100today igot 1:650 RR trade in #nas1004ht pd aray
and
15min aray
and
1 min entry

NQ/US100/NAS100 Short - Day Trades 1:2 RRRisking 1% to make 2%
NAS100, US100, NQ, NASDAQ short for day trade, with my back testing of this strategy, it hits multiple possible take profits, manage your position accordingly.
Risking 1% to make 2%
Use proper risk management
Looks like good trade.
Lets monitor.
Use proper risk management.
Disclaimer: only idea, not advice

NASDAQ-100 (NDX) daily analysis by TradingDONAlright, folks: here’s my take on today’s 15‑minute CAPITALCOM:US100 action—Buckle up.📈
**When the Market Faked Us Out**
I was watching price flirt with a fresh high up around 18,500–18,550, but it couldn’t stick. You know that moment: the rally teases you into thinking bulls have taken over, then promptly rolls over. I marked the false higher‑high with a tiny red “X” on my chart—classic stop‑hunt before the reversal. In plain English: institutions swept buy stops, then handed off into those get‑rich‑quick hopes.
**Key Zones:**
- **Premium (18,800+):** Smart money sells here—price always stalls or dumps.
- **Discount (18,000–18,100):** Institutions buy the dip—bounces here carry weight.
**FVGs & Stop‑Hunt:**
I’ve got Fair Value Gaps around 17,600–17,750 that act like magnets on a pullback. The drop to 17,562.6 was a classic sell‑side stop hunt before the big reversal.
- Distribution hit the Premium zone.
- Accumulation’s brewing in the Discount zone + FVGs.
- That sweep of 17,562.6 was classic smart‑money stop‑hunt + scoop.
- 💡My long at ~17,880 sits at a neat support confluence—so, for now, I’m leaning bullish to the next structural level.
*This is my educational breakdown of ICT concepts—not trading advice. Do your own homework and manage risk.*

STOCKS LOWER??This is what Im gauging on the NAS100, as well as the Dow Jones and SnP500 (even though the charts aren't presented).
Technically, I see a 4H QM which sets the high, with the lows not giving the same HTF strength that the highs have given. We've got a nice trading range as price hasn't realigned for the stocks to show its true bullish direction to the ATHs, meaning I see this huge sell off continue until those lows have been ran. I see price printing lower.
Fundamentally, I like to think of the worst case scenario for Trump and the season we're in currently, its made me nice trades. Lets see

NAS100 Buy Trade Analysis (4H Timeframe)Entered a buy position on NAS100 after price retraced to the 0.618 Fibonacci level, which also aligns perfectly with the ascending trendline support. This area has acted as a strong confluence zone, showing signs of a potential higher low (HL) formation on the 4H chart.
✅ Confluences supporting the trade:
Price bounced from the 0.618 Fib retracement.
Respecting the trendline support indicating bullish structure continuation.
Formation of Higher Low on both the 4H timeframe and also clearly visible on Daily and Weekly charts, indicating strong bullish momentum from a higher timeframe perspective.
RSI is near the oversold zone (~30), showing signs of a potential bullish reversal.
🎯 Targets:
First TP around the 18,863 zone (previous resistance area).
Final TP in the region of 19,161–19,250, aligning with the 200 EMA and psychological resistance levels.
🛡️ Stop Loss: Placed below the trendline and previous swing low for protection in case of invalidation.

Definite downward trend. Great buying potential in near future.Hello all traders and learner charters. As you can see definite downward trend.
Some are even saying sell everything.
I added the five year percentages, as you can see its not very promising for the moment,
but definitely promising for anyone wanting to get into nasdaq or SP500.
There are seldom opportunities like this.
I would suggest to keep watching it, as a lot of people who rode the bull market after
Trump call, have taken there profits and sold. This trend will force others to sell as no one
wants to make a loss on nasdaq. So with that in mind, it will be red all over for a while I would say about two weeks maybe even more, but if you just keep on buying little amounts
DCA dollar cost averaging, you will get some good buying positions down low. And then hold them for the next few years. This is a great opportunity. Good luck.

NASDAQ Decision making becomes easy after seeing this chart.NASDAQ (NDX) is currently on the 3rd straight red month (1M candle), following the February High and subsequent sell-off due to the Trade War. This has been analyzed extensively in previous analyses and how the fundamental scene is only now starting to show some positive progress but still has a long way to go.
Technically though, the picture is very clear and favors long-term investing. The market has been trading within a Fibonacci Channel Up since the U.S. Housing Crisis in 2008 and along with the 2022 Inflation Crisis, those have been the only real Bear Cycle events in the past 18 years.
In between those there have been another 5 shorter term corrections, that offered great buying opportunities for the long-term and the recent 3-month one classifies as one.
There reasons are three. First it has come very close to the 1M MA50 (blue trend-line), which only broke during the Major Corrections. Second, the 1M RSI hit the 50.50 Symmetrical Support, which has held during all those 5 prior Minor Corrections. Third, those corrections only range between two Fibonacci levels.
The current correction fulfills all those conditions. And since the 'weakest' rally we've have on this 5 event sample has been +37.57% and the strongest +96.77%, we have a medium-term Target on Nasdaq at 22800 and a long-term one at 32500.
Do you still reserve doubts at investing long-term after seeing this macro chart?
-------------------------------------------------------------------------------
** Please LIKE 👍, FOLLOW ✅, SHARE 🙌 and COMMENT ✍ if you enjoy this idea! Also share your ideas and charts in the comments section below! This is best way to keep it relevant, support us, keep the content here free and allow the idea to reach as many people as possible. **
-------------------------------------------------------------------------------
💸💸💸💸💸💸
👇 👇 👇 👇 👇 👇

Hanzo | Nas100 15 min Breaks – Will Confirm the Next Move🆚 Nas100 – Hanzo’s Strike Setup
🔥 Timeframe: 15-Minute (15M)
———————
💯 Main Focus: Bullish Breakout at 18160
We are watching this zone closely.
📌 If price breaks with high volume, it confirms Smart Money is in control, and a strong move may follow.
💯 Main Focus: Bearish Breakout at 18000
We are watching this zone closely.
📌 If price breaks with high volume, it confirms Smart Money is in control, and a strong move may follow.
———
🔻 Every warrior needs a tribe.
Follow Hanzo. Support the path.
Analysis
👌 Bearish Signs (15M TF):
• Liquidity Grab + CHoCH at 18700
• Liquidity Grab + CHoCH at 18400
• Strong Rejections seen at:
➗ 18400 – Major support
➗ 19000 – Proven resistance
———
🩸 Key Zones to Watch:
• 18700 – Bearish breakout level
• 19130 – Strong resistance (tested 6 times)
• 18400 – Equal lows

US100 21.04.2025+US Leading Index Miss
+COT Bearish
~+General gloomy sentiment about tariffs, Fed's independence & trade talks with Japan
~-thin volumes after holidays
