NDX multiple channels, Which one is correct?Channels can be drawn in many ways because of fractal nature of markets. Every one could draw different channels and they all could be valid, So I prefer to draw a few likely ones some short term and others long term and find a cluster of convergence for high probability. No one is perfect
So just presenting what I see in NDX, mot likely ones
I expect Vix to reach 70, levels reached in 2008-GFC and 2020-covid. The tariff is a significant event in American history
USTEC trade ideas

Tariff news push down market, V sharp recovery still possibleDisclaimer: The following reflects personal opinions only and does not constitute investment advice. Please exercise your own judgment before making any decisions.
From Monday to Wednesday this week, the Nasdaq experienced a notable rebound, briefly climbing to 19,898 prior to the release of tariff-related news. However, the actual tariff figures and calculation methods far exceeded market expectations, causing a sharp sell-off once the announcement was made. On Friday, markets dropped further after China, the EU, and other countries announced retaliatory tariff measures. The VIX surged to 45.61 on Friday.
On Friday, Federal Reserve Chair Jerome Powell commented that the Fed remains in a wait-and-see mode regarding the future of tariffs. He noted that while tariffs could have short-term inflationary effects, current data shows inflation has significantly declined and the underlying U.S. economy remains strong. While this provided some support to the market, it was not enough to spark a meaningful rebound.
Key market concerns include:
1. Higher tariffs could lead to rising inflation, potentially delaying Fed rate cuts.
3. Tariff hikes and retaliatory measures may negatively impact multinational companies such as Apple and Nike that rely heavily on global markets and supply chains, resulting in lower revenues and increased operational costs.
3. Escalation of the trade war and more retaliatory measures may further dampen sentiment.
In the week ahead, markets will likely remain sensitive to policy developments.
A. If the Trump administration manages to reach agreements with certain countries to lower tariffs in exchange for concessions. Market sentiment could shift quickly, with investors viewing the tariff hike as a negotiation tactic with only short-term implications. - Vshape recovery
B. On the other hand, if the trade war continues to escalate, it would pose a clear negative for the markets.
Another potential headwind is the threat of U.S.-Iran conflict.
The Trump administration has repeatedly warned of possible military action against Iran. If such a conflict breaks out, markets may fear that Iran could block oil and gas shipments through the Strait of Hormuz, pushing up energy prices and triggering a broad risk-off move.
From a technical perspective, the market has broken below the upward trendline that has been in place since 2022, and continued to decline after retesting that level this week. Without a swift rebound, further downside is possible. Key support levels to watch are 16,962, 16,127, and 15,163.
That said, the tariff news has been priced in to some extent, and the VIX has already spiked above 45. The U.S. economy remains fundamentally solid, making it difficult for bearish sentiment to persist over the long term. Given Trump's negotiating style, some positive developments on tariffs are likely in the coming weeks. Meanwhile, the Fed has further reduced its balance sheet runoff in April, with QT now nearing its end.
In my view, short-term bearish sentiment may be near a turning point. There is a high probability of a rebound, but it’s essential to wait for further confirmation — either for negative news to subside or for a technical rebound signal to emerge.
At current levels, shorting the market carries high risk. Unless new negative catalysts or fundamental deterioration arise, I personally would not consider initiating short positions at this time.

Death Cross forming now on NDX weekly chartHi Renny here back with a chart for you guys to check out.
50 dma can be seen to be crossing below the 200 dma.
Look what happened after the last time that happened in 2022...
You would have done well to take money off the table the last time the 50 dma crossed below the 200 dma.
What's your take? Is there more downside from here?

NASDAQ Elliott Wave Analysis – Wave 4 Pullback in PlayNASDAQ is currently reacting to a major support zone, aligning with the Elliott Wave structure. Based on this analysis, we are in the midst of a Wave 4 pullback, which is expected to complete soon. Once Wave 4 finds its base, we anticipate a strong impulsive move to the upside—Wave 5—pushing us toward a new all-time high (AHT).
📉 Watching for confirmation of support holding before entering long.
📈 Targeting a continuation toward new highs following the completion of this corrective phase.

NASDAQ tanks below key levels amid new Trump tariffs!The market free-falls as Trump's new tariffs send shockwaves through global sentiment.
Sellers are piling in — but it's the fear of economic fallout that's truly fuelling this drop.
The NAS100 has broken through major support zones with strong bearish momentum.
Sellers are clearly in control, and price action shows little sign of slowing down.
Structure around 18,324 failed to hold. Next major support zone: 16,968.5.
Will the bleeding stop there?
⚠️ Reminder:
No one can predict what will happen next.
Markets react to collective psychology, news flow, and big players—not forecasts.
✅ Focus on:
-Key Levels 🔎
-Market Structure 📐
-Risk Management 🛡️
❌ Don’t trade based on emotion or prediction.
🎯 Trade based on probability, not certainty.
👉 Let price confirm your bias — watch for clear breakouts, retests, or rejections before jumping in.
Stay patient, stay disciplined. 📈📉

NASDAQ Bearish, What's Next?Price respected Weekly's bearish imbalance to continue lower. Still price is within the weekly's context area to which is suitable to look for entries in lower timeframes targeting weekly's swing low (POI).
Once, the Weekly POI get's tagged we might look to continue to the next POI (Point of Interest). Likely, the daily swing lows.
What's Next?
Pontetial target price is 18,537.88.


"NAS100 / US100" Index CFD Market Heist Plan (Day or Swing)🌟Hi! Hola! Ola! Bonjour! Hallo! Marhaba!🌟
Dear Money Makers & Robbers, 🤑 💰💸✈️
Based on 🔥Thief Trading style technical and fundamental analysis🔥, here is our master plan to heist the "NAS100 / US100" Index CFD Market. Please adhere to the strategy I've outlined in the chart, which emphasizes long entry. Our aim is the high-risk Red Zone. Risky level, overbought market, consolidation, trend reversal, trap at the level where traders and bearish robbers are stronger. 🏆💸"Take profit and treat yourself, traders. You deserve it!💪🏆🎉
Entry 📈 : "The heist is on! Wait for the MA breakout (20000) then make your move - Bullish profits await!"
however I advise to Place Buy stop orders above the Moving average (or) Place buy limit orders within a 15 or 30 minute timeframe most recent or swing, low or high level.
📌I strongly advise you to set an alert on your chart so you can see when the breakout entry occurs.
Stop Loss 🛑:
Thief SL placed at the recent/swing low level Using the 1H timeframe (19400) swing trade basis.
SL is based on your risk of the trade, lot size and how many multiple orders you have to take.
🏴☠️Target 🎯: 20800 (or) Escape Before the Target
🧲Scalpers, take note 👀 : only scalp on the Long side. If you have a lot of money, you can go straight away; if not, you can join swing traders and carry out the robbery plan. Use trailing SL to safeguard your money 💰.
"NAS100 / US100" Index CFD Market Heist Plan (Swing/Day) is currently experiencing a bullishness,., driven by several key factors.
📰🗞️Get & Read the Fundamental, Macro, COT Report, Geopolitical and News Analysis, Sentimental Outlook, Intermarket Analysis, Index-Specific Analysis, Positioning and future trend targets.. go ahead to check 👉👉👉
📌Keep in mind that these factors can change rapidly, and it's essential to stay up-to-date with market developments and adjust your analysis accordingly.
⚠️Trading Alert : News Releases and Position Management 📰 🗞️ 🚫🚏
As a reminder, news releases can have a significant impact on market prices and volatility. To minimize potential losses and protect your running positions,
we recommend the following:
Avoid taking new trades during news releases
Use trailing stop-loss orders to protect your running positions and lock in profits
💖Supporting our robbery plan 💥Hit the Boost Button💥 will enable us to effortlessly make and steal money 💰💵. Boost the strength of our robbery team. Every day in this market make money with ease by using the Thief Trading Style.🏆💪🤝❤️🎉🚀
I'll see you soon with another heist plan, so stay tuned 🤑🐱👤🤗🤩

US markets have a little more downsideI had posted a similar chart a few weeks ago.....US companies fundamentals may be good, but price follows technicals. There is still some more downside, which I think would be where JPow said Inflation is no longer transitory, then we see some consolidation, then another fall to shake out the bulls, by which time we would reach the bottom of the monthly channel and then uptrend can resume after a bit of consolidation. Remember the Trump tariffs are just catalyst, a reason for market to get where it wants to be sooner. Do remember that market rallied when inflation hit a peak of 9%.....All this news is just noise....You know where the level of interests are and trade accordingly....Markets will not go up in a straight line neither will it go down in a straight line.....The Fear & Greed Index is at 4 as per CNN. This is only for investors, start buying small positions in your favorite stock....only a little, bit by bit, with every fall, or you can wait....Don't put all your savings in the market because it fell substantially...Selling begets selling, the opposite is also true.....Market can head to 14000 as well, I'm not ruling that out, but i'm expecting a really nice bounce from the JPow, however, be very aware of the overhead resistance.....Bears have not had a chance for a long time, and they will squeeze every ounce of blood from the bulls while they can....Just remember, Bulls are complacent, Bears are tactical.....Throughout history that has been the case....

NASDAQ LEADERSHIPNASDAQ Correction 21% what happen?
if this too late, making another asset distractions, volatility.

US100 has taken strong support at 17KUS100 has taken strong support at 17K. If it breeaks this support, it will reach to next level of 16 K. After China responded to U.S. tariffs by introducing a 34% tariff on all American imports starting April 10, stock market losses deepened on Friday. This downturn was further triggered by comments from Federal Reserve Chair Jerome Powell, who warned that the impact of a trade war could be more severe than expected. He noted that it could lead to slower economic growth and increased inflation, adding that the Fed is in no rush to cut interest rates in response.

NDX : It's time to take a step backThis is a level I'll be closely watching for making aggressive additions. Until then, only selective entries in U.S. Oil ETFs, Silver and Gold ETFs, and a few individual stocks may be considered. However, large-scale accumulation is not advisable until this level is reached.
I may also consider dollar-cost averaging into index ETFs if I start to see signs of consolidation from here onward.
📢📢📢
If my perspective changes or if I gather additional fundamental data that influences my views, I will provide updates accordingly.
Thank you for following along with this journey, and I remain committed to sharing insights and updates as my trading strategy evolves. As always, please feel free to reach out with any questions or comments.
Other posts related to this particular position and scrip, if any, will be attached underneath. Do check those out too.
Disclaimer : The analysis shared here is for informational purposes only and should not be considered as financial advice. Trading in all markets carries inherent risks, and past performance is not indicative of future results. It’s essential to conduct your own research and assess your risk tolerance before making any investment decisions. The views expressed in this analysis are solely mine. It’s important to note that I am not a SEBI registered analyst, so the analysis provided does not constitute formal investment advice under SEBI regulations.

'02 & '08 vibes is here for NasdaqI think Nasdaq is heading to MA200. We're about to experience '02 / '08 vibes again?

NAS100 Turn of the Month Strategy Meets Market Volatility!In this video, we dive into the Turn of the Month Strategy and explore how it could play out in the current market environment. Historically, mutual funds rebalance their portfolios at the end of the month, creating buying pressure that often leads to higher stock prices into the new month. Additionally, recurring financial inflows, such as monthly salary payments and pension contributions, tend to boost market demand during this period.
However, this month presents a unique challenge. The NASDAQ 100 has capitulated into the end of the month, driven by heightened volatility and uncertainty fueled by Donald Trump's rhetoric. With the market currently trading into a significant support zone and liquidity pool, we analyze whether the Turn of the Month effect can counteract the recent bearish momentum.
📊 Key Highlights in the Video:
Price Action Analysis: The NASDAQ 100 is deeply overextended, trading into a critical liquidity pool.
Trade Idea: A potential counter-trend rally could emerge as the market seeks to correct and rebalance.
Strategy: Look for a short-term rally into resistance, followed by a possible shorting opportunity as the market resumes its downward trend.
This video is perfect for traders looking to combine price action trading with seasonal strategies like the Turn of the Month effect. Will the market rally into the new month, or will bearish momentum prevail? Watch now to find out! 🚀

Short Position - NASDAQShort Position Entry: Consider initiating a short position if the Nasdaq-100 Index falls below 21,000.
Stop Loss (SL): Set a stop loss at 21,555 to manage potential losses.'
Market Sentiment: The combination of the Federal Reserve's cautious approach and rising inflation may contribute to a weakening market sentiment, potentially leading to a downward movement in the index.
his recommendation is for educational purposes only. Always consult your financial advisor before making any investment decisions. Stock trading involves risks, including the potential loss of capital. Ensure to evaluate your risk tolerance and conduct thorough research.

A BIGGER PICTURE OF US100 SHOWING A BREAKOUT!Take a look at the bigger picture of US100 from the monthly timeframe. We can understand the nature of price action that has occurred. We can see how price broke out of the rising channel leading to over 68% decline of the total gains made in the year 2024. This further awake traders mindset to whether there’s gonna be a further drop maybe upto a pullback support of 16426.4 or even below.
From the technical standpoint, we may expect -5% more drop before we begin to see some form of recovery.

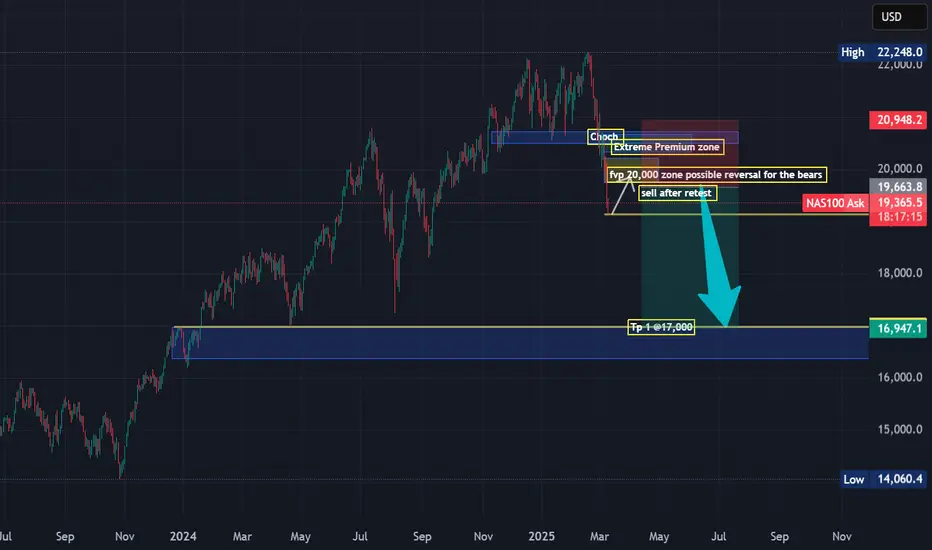
@Nas Bears seeks The 17,000 handle as Recession fears spark sellfor Mexico, Canada, and the U.S. due to the turbulent rollout of Trump tariffs, which has created significant uncertainty for businesses and policymakers.
Concerns over inflation in the U.S., which were already growing, have intensified, making it more likely that the Federal Reserve will hold off on policy changes for the foreseeable future. Meanwhile, the risk of recession is increasing across all three countries, and that was witnessed On Monday as wallstreet painted its boards with Red arrows which was not a good sign that being said am anticipating that the Bearish rally will continue till we mitigate @17,000 handle.
waiting for Retest @20,000 Before the bears come in
Tp.17,000 which will be some days to come from today.
NASDAQ CRASH: Are We in a Bear Market? Let’s Break it Down!The NASDAQ 100 (NDX) just took a huge dive, dropping 21.69% from its recent highs. That officially meets the definition of a bear market (a decline of 20% or more). The question is: Are we going lower, or is a reversal coming? Let’s analyze the moving averages, Fibonacci levels, and key market signals to figure out what’s next.
📊 Moving Averages Breakdown: A Bearish Trend Confirmation?
One of the biggest red flags here is how the price is behaving relative to its moving averages:
🔴 Short-Term Moving Averages (Yellow & Green - 9 EMA & 21 EMA)
These are the fastest-moving indicators and help us track momentum.
The price has been consistently closing below them, showing strong bearish pressure.
Whenever the price tries to bounce, it gets rejected at these levels, signaling weak demand.
🟠 Mid-Term Moving Averages (Orange - 50 MA)
The 50-day moving average acts as a key support/resistance zone in many market trends.
In this chart, we saw a breakdown below the 50 MA, and since then, the price hasn’t even attempted to reclaim it.
This suggests that even mid-term traders are losing confidence, leading to further selling pressure.
🔵 Long-Term Moving Averages (Blue - 200 MA)
The 200-day moving average is a critical level for defining long-term trends.
Right now, the index is trading well below the 200 MA, which signals a major trend shift—we're no longer in a bull market.
The further we move away from this level, the harder it becomes for bulls to regain control.
➡️ Conclusion: All key moving averages are trending downward, and the price is failing to reclaim even short-term levels. This means we are likely in a sustained bear market unless we see a major reversal.
Key Fibonacci Levels & Market Structure
We are currently testing the 1.618 Fibonacci extension at 17,268. If this level fails, we could see further downside towards 15,771 (2.618 Fib) or even lower.
Any bounce will face major resistance at 18,500 - 19,100, where multiple Fib retracements and moving averages converge.
🔥 What’s Next?
If buyers step in at 17,268, we might see a relief rally.
If we break below it, expect 15,771 or even 14,273 to be the next downside targets.
Watch the moving averages closely if we start reclaiming the 9 & 21 EMA, that could be an early sign of a recovery.
Are we heading deeper into a bear market, or is this just a big correction before another bull run? Drop your thoughts below!

NAS100/US100/NQ/NASDAQ Long-Bet Me, Others Sell=I BuyNAS100, US100, NQ, NASDAQ Long for 2 Weeks, it could drop a little forsure because I didn't get bullish confirmation but with my back testing of this strategy, it hits multiple possible take profits atleast TP-1, manage your position accordingly.
Use proper risk management
Looks like good trade.
Lets monitor.
Use proper risk management.
Disclaimer: only idea, not advice

NAS100/US100/NQ/NASDAQ Long NAS100, US100, NQ, NASDAQ Long, with my back testing of this strategy, it hits multiple possible take profits atleast TP-1, manage your position accordingly.
Use proper risk management
Looks like good trade.
Lets monitor.
Use proper risk management.
Disclaimer: only idea, not advice

Nasdaq Long: Ending DiagonalHi, I made an update 3 hours ago regarding reducing short position and staying neutral because of wave 4. However, it seems like wave 5 of 3 extended and is now showing me an ending diagonal. This changes the assessment from neutral to long as ending diagonal are usually swift and sharp move reversals.
Take note that the last wave of the ending diagonal might itself be an ending diagonal. So my suggestion is to scale in the long and give a slightly wider stop below the lower trendline.
Good luck!


US100Rising wedge target to the downside complete.
ABCD pattern completed at very strong support level.
This thing is going to bounce very hard.
