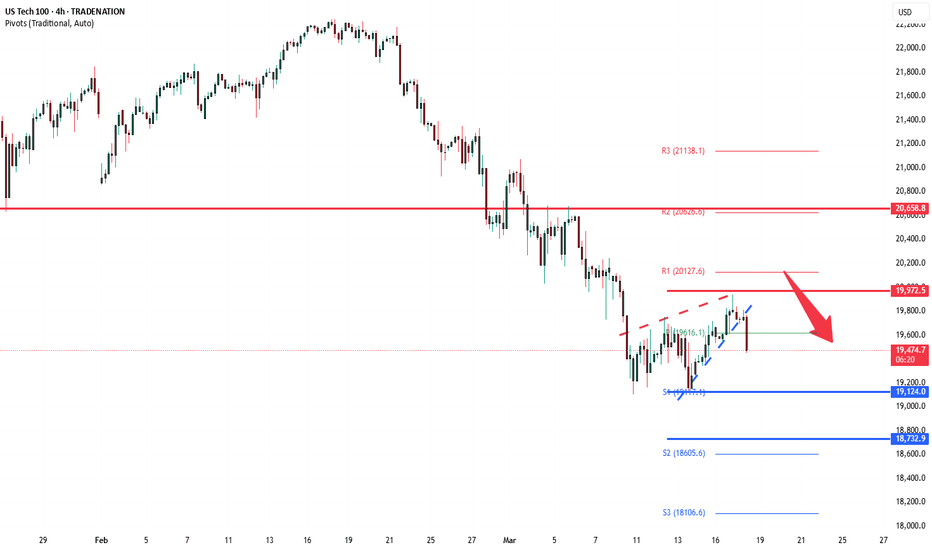
Emergence of Bear Flag in Nasdaq The price action seems to be suggesting the formation of Bear Flag Pattern.
The price fell steeply and then gave a pullback, which is getting sold into.
As the channel of flag breaks downwards, the fall may gain momentum.
Further price action will confirm or negate the pattern, it may move cleanly or will have whipsaws.
If the price starts consolidating for long here, rather than breaking downwards, the pattern may fail.
Trade Safe
USTEC trade ideas
NSDQ100 INTRADAY Oversold bounce back capped at 19972Key Support and Resistance Levels
Resistance Level 1: 19972
Resistance Level 2: 20127
Resistance Level 3: 20658
Support Level 1: 19124
Support Level 2: 18732
Support Level 3: 18100
This communication is for informational purposes only and should not be viewed as any form of recommendation as to a particular course of action or as investment advice. It is not intended as an offer or solicitation for the purchase or sale of any financial instrument or as an official confirmation of any transaction. Opinions, estimates and assumptions expressed herein are made as of the date of this communication and are subject to change without notice. This communication has been prepared based upon information, including market prices, data and other information, believed to be reliable; however, Trade Nation does not warrant its completeness or accuracy. All market prices and market data contained in or attached to this communication are indicative and subject to change without notice.
Hanzo | Nas100 15 min Breaks Structure – Confirm the Next Move🆚 Nas100 – The Way of the Silent Blade
⭐️ We do not predict—we calculate.
We do not react—we execute.
Patience is our shield. Precision is our sword.
🩸 market is a battlefield where hesitation means death. The untrained fall into traps, chasing shadows, believing in illusions. But we are not the crowd. We follow no signal but the one left behind by Smart Money. Their footprints are our way forward.
🩸 Bullish Structure Shatters -
Key Break Confirms the Path – 19830
reasons
Liquidity Swwep
liquidity / choch
key level / multi retest before
weekly / monthly zone
🩸 Bearish Structure Shatters
Key Break Confirms the Path – 19700 Zone
our reversal always at key level
even a reversal area is well studded
reasons
Liquidity Swwep
liquidity / choch
key level / multi retest before
weekly / monthly zone
🔻 This is the threshold where the tides shift. If price pierces this level with authority, it is no accident—it is designed. The liquidity pool above has been set, and the institutions will claim their prize. Volume must confirm the strike. A clean break, a strong push, and the path is set.
Watch the volume. Watch the momentum. Strike without doubt
US100 - Uptrend in Motion with Key Support LevelsOverview:
The US100 is currently trading within a well-defined upward channel, forming higher lows and maintaining a strong bullish structure. The price action suggests that as long as it stays within this channel, the bullish momentum is intact. However, there are key levels to watch if the structure is broken. A break below the channel could lead to a retracement toward an imbalance zone, which may act as a strong support area. If this level fails to hold, a deeper correction could follow.
Uptrend and Higher Lows Indicate Strength
The market is making consistent higher lows, confirming the presence of an uptrend.
The price remains within the ascending channel, suggesting that buyers are in control.
As long as the channel holds, we can expect a continuation of the bullish move with higher highs
Potential Scenarios:
Bullish Continuation Within the Channel
If the price continues to respect the channel structure, we could see further upside movement.
A bounce from the lower trendline of the channel would confirm strength and could lead to new highs.
Retracement to the Imbalance Zone
If the price breaks below the channel, it may find support at the imbalance zone.
This area has previously acted as a reaction point, and buyers could step in again.
A strong bullish reaction from this zone would provide confirmation for a potential move back up.
Bearish Breakdown Below the Imbalance Zone
If the imbalance zone fails to hold, selling pressure could increase.
This could trigger a deeper pullback, leading to a test of lower support levels.
Key Levels to Watch:
Channel Support – If price remains inside, expect continued bullish momentum.
Imbalance Zone – A critical area where price could find support if the channel breaks.
Lower Support Levels – If both the channel and imbalance zone fail, a larger correction could follow.
Conclusion:
US100 remains bullish as long as it trades inside the channel, with higher lows supporting the uptrend. However, traders should monitor the channel breakout, as a move below could lead to a retest of the imbalance zone. If buyers hold this level, the uptrend may resume, but failure to hold could open the door for a further drop.
__________________________________________
Thanks for your support!
If you found this idea helpful or learned something new, drop a like 👍 and leave a comment, I’d love to hear your thoughts! 🚀
Make sure to follow me for more price action insights, free indicators, and trading strategies. Let’s grow and trade smarter together! 📈
NAS100 possibility of price rising/Divergence with US30On the higher timeframe, NAS100 maintains a bullish momentum. In recent days, the index has experienced a decline from the 22,226 high to 19,113. Notably, it has been trading within a rising channel and is currently positioned near the channel's support area. On lower timeframes, a divergence with the Dow Jones Index (US30) has been observed, suggesting a potential reversal. If a reversal occurs, an upward move toward 20,625 is anticipated, with a potential extension to 21,360.
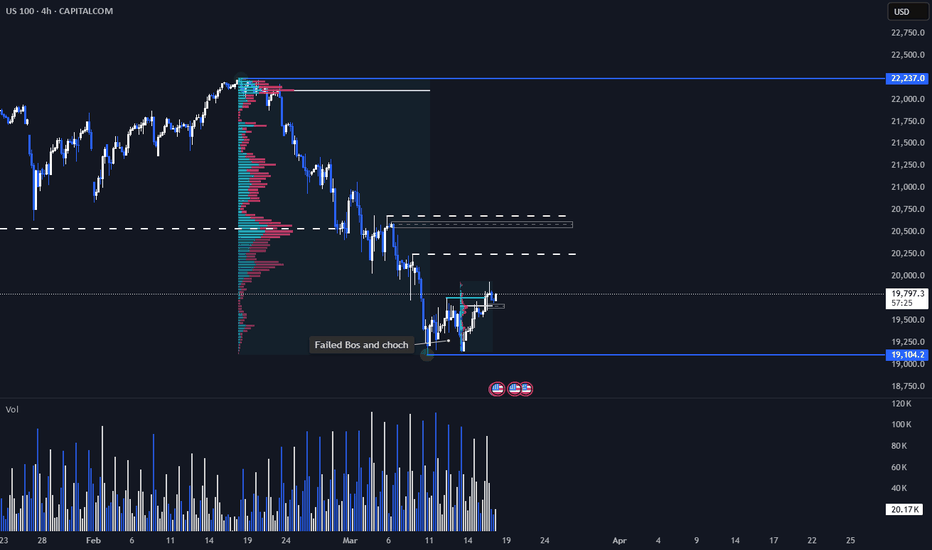
A high-probability prediction of where the markets might go From what I see, I think the markets could reverse direction and make a new BoS on the 4 timeframe. We filled the FVG, took liquidity in the 4h structure and now we have not been able to make a new swing point, which resulted in ChoCh. Also the volume is high, this means a lot of liquidity was taken and reversal is happening (accumulation).
Macro data tells us that inflation has fallen, which could result in a rate cut. Uneployment also rose, which is another good indicator that supports my idea. PPI is negative this means producers are not raising prices. Overall everything is pretty pozitive, and I don't think Trump will affect this either.
People are getting used to it and the economy is adapting.
Whats you opinion on my analysis and todays market conditions?
Tell me your idea, i am opened to everything as always :)
NASDAQ INDEX (US100): Important Breakout I spotted a great example of a bullish reversal on 📈US100.
The index formed a double bottom pattern on a 4-hour chart and broke and closed above a resistance line of a descending channel.
There is a positive response on retesting the key support level based on a broken neckline.
It is expected that the index will continue to rise towards the 20,000 / 20180 levels.
US100 Technical Analysis by TradingDONIf the NQ CAPITALCOM:US100 closes a 1-hour candle below the Fibonacci trend line and shows strong bearish momentum, I will set my target at 19,580. Conversely, if the NQ closes a 1-hour candle above the trend line with a strong bullish candle, I will identify 19,930 as the resistance level.
RISK ON or RISK OFF?? Correlations between JPY and the IndicesAs a trader it is imperative that you understand the correlation between the indices and 'flight to safety' currencies and how this determines whether you are in a risk on or risk off environment and how quickly that can change. You can use this information to help you make informed trading decisions in the market
NASDAQ and Elliott Wave.A 5 Wave move to the upside started around mid October 2022. Wave 2 was a Zigzag and 4 should be a Flat as per the rules. Indeed Wave 4 is a Flat and we are currently on Wave B of the Flat marked in Black. As we know, Wave B of a Flat MUST have 3 Waves(Two impulse and one corrective) marked as A,B,C(all in Green) and we are on the last Wave(C) of Wave B. A retest on the Fib level 161.8% would trigger a Wave C(Black) which would be Wave 4. All analysis is backed by Math and Logic.
Bullish bounce?USTEC has reacted off the pivot and could potentially rise to the 1st resistance that lines up with the 38.2% Fibonacci retracement.
Pivot: 19,631.95
1st Support: 19,126.61
1st Resistance: 20,332.42
Risk Warning:
Trading Forex and CFDs carries a high level of risk to your capital and you should only trade with money you can afford to lose. Trading Forex and CFDs may not be suitable for all investors, so please ensure that you fully understand the risks involved and seek independent advice if necessary.
Disclaimer:
The above opinions given constitute general market commentary, and do not constitute the opinion or advice of IC Markets or any form of personal or investment advice.
Any opinions, news, research, analyses, prices, other information, or links to third-party sites contained on this website are provided on an "as-is" basis, are intended only to be informative, is not an advice nor a recommendation, nor research, or a record of our trading prices, or an offer of, or solicitation for a transaction in any financial instrument and thus should not be treated as such. The information provided does not involve any specific investment objectives, financial situation and needs of any specific person who may receive it. Please be aware, that past performance is not a reliable indicator of future performance and/or results. Past Performance or Forward-looking scenarios based upon the reasonable beliefs of the third-party provider are not a guarantee of future performance. Actual results may differ materially from those anticipated in forward-looking or past performance statements. IC Markets makes no representation or warranty and assumes no liability as to the accuracy or completeness of the information provided, nor any loss arising from any investment based on a recommendation, forecast or any information supplied by any third-party.
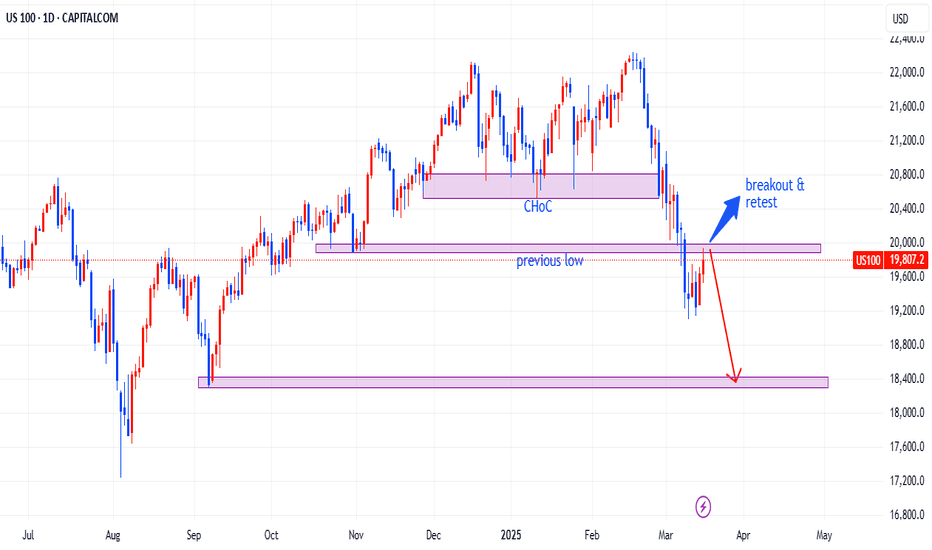
US100 dropping? here's why I think soAs we can see the previous trend was an uptrend, we got a Change of Trend before the market dropped showing strong selling pressure and now the price looks like it's Retracing(Retest) before it continues it's movement down
what are your opinions on NAS100?🙃comment below
Hanzo | Nas100 15 min Breaks Structure – Confirm the Next Move🆚 Nas100 – The Way of the Silent Blade
⭐️ We do not predict—we calculate.
We do not react—we execute.
Patience is our shield. Precision is our sword.
🩸 market is a battlefield where hesitation means death. The untrained fall into traps, chasing shadows, believing in illusions. But we are not the crowd. We follow no signal but the one left behind by Smart Money. Their footprints are our way forward.
🩸 Bullish Structure Shatters -
Key Break Confirms the Path – 19750
reasons
Liquidity Swwep
liquidity / choch
key level / multi retest before
weekly / monthly zone
🩸 Bearish Structure Shatters
Key Break Confirms the Path – 19540 Zone
our reversal always at key level
even a reversal area is well studded
reasons
Liquidity Swwep
liquidity / choch
key level / multi retest before
weekly / monthly zone
🔻 This is the threshold where the tides shift. If price pierces this level with authority, it is no accident—it is designed. The liquidity pool above has been set, and the institutions will claim their prize. Volume must confirm the strike. A clean break, a strong push, and the path is set.
Watch the volume. Watch the momentum. Strike without doubt
NAS100 Bullish Trading IdeaMarket Structure & Key Levels
Bullish Market Structure: The price has been making higher highs and higher lows.
4-Hour Order Block (OB): The price recently reacted from a 4-hour order block, confirming bullish intent.
Unmitigated Wick: There’s an unmitigated wick above 20,160, acting as a liquidity target.
Liquidity Pool Below: A possible retracement to sweep liquidity before the next bullish push.
Trade Setup (ICT)
Entry Zone: Look for a retracement to the 19,800 - 19,820 region, which aligns with an order block and potential fair value gap (FVG).
Stop-Loss: Below 19,700 (under the liquidity sweep level).
First Target (TP1): 19,995 (previous high and potential resistance).
Final Target (TP2): 20,160+ (liquidity grab from the unmitigated wick).
Confirmation Factors
Displacement & FVG: Look for an aggressive bullish push from discounted price levels.
London & New York Session Influence: NY session open may trigger liquidity grab before the bullish move.
Trading View Idea: Nasdaq 100 SPOT (Technical & Fundamental OutlTechnical Analysis:
Key Levels: Immediate support at 19,664.50 (current price), with critical demand zones near 19,200–19,600. A break below could target 18,268.75 (next major support). Resistance levels begin at 20,400–20,800.
Price Action : Consolidation between SELL (19,664.25) and BUY (19,665.05) zones suggests indecision. Watch for a breakout; holding above demand zones may signal bullish reversal potential.
Fundamental Drivers:
USD Influence: Monitor the US Dollar Index (DXY). A stronger dollar could pressure Nasdaq 100, given its tech-heavy export exposure.
Macro Factors: Fed policy shifts, inflation data, and tech sector earnings will drive sentiment.
Trade Idea:
Bullish Scenario: Hold above 19,664.50 with SL at 19,200, targeting 20,400.
Bearish Trigger: Close below 19,200 opens downside toward 18,268.75.
Call to Action:
👉 Follow for alerts on breakout/breakdown scenarios.
👉 Share this analysis to empower others with data-driven decisions.
Engage with My Latest Trading Setup & Share Insights!
Risk Note: Tight stops advised amid volatility. Align entries with DXY trends and economic catalysts.


