Technical and digital analysisWe notice that we are in an upward correction and there is an increase in momentum. We are waiting for sellers to weaken in order to buy
USTEC trade ideas

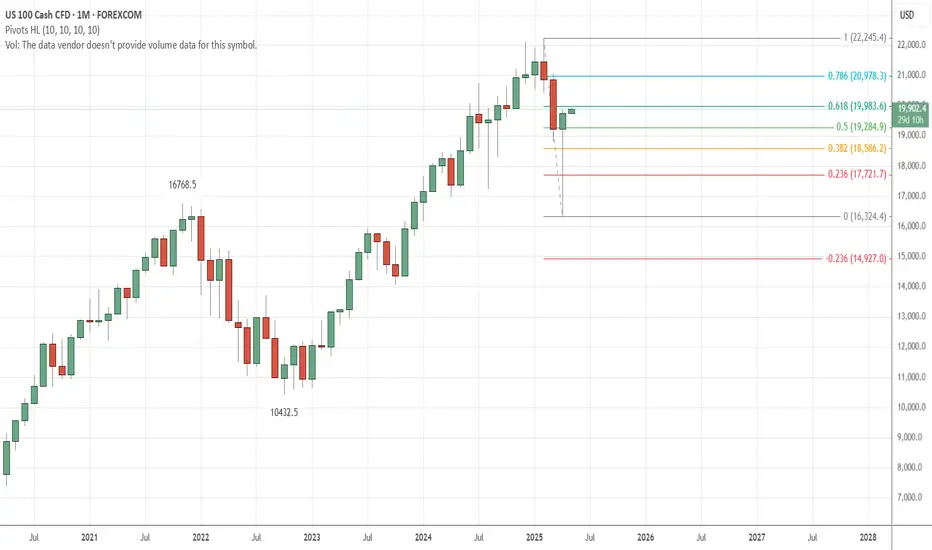
NQ: Unexpected bullish Monthly close!NQ Monthly candle was bullish! Price retraced up to 61.8 fib. From this TF, we should expect a continuation up!!
This is against my weekly analysis that projected 5 down waves and price has reached the end of Wave 2.
Let see how it works out.
NAS100USD: Institutional Selling Initiated at Premium LevelsGreetings Traders,
Today on NAS100USD, the market is currently operating within a clear bearish institutional order flow. In alignment with this directional bias, we are seeking selling opportunities supported by several key confluences.
Key Observations:
1. Liquidity Sweep at Premium Pricing:
Price has retraced deeply into a premium zone, sweeping the buy stops above a recent swing high. This suggests smart money is executing sell-side order pairing at extreme premium levels, utilizing retail liquidity for institutional distribution. When this occurs, price typically seeks rebalancing at fair value zones and continues toward discount levels.
2. Resistance at Fair Value Gap:
Following the liquidity sweep, price encountered resistance at a previously identified fair value gap (FVG). This FVG has held effectively, reinforcing the bearish outlook and acting as a high-probability rejection zone.
3. Market Structure Shift (MSS):
The market has now confirmed a bearish market structure shift, further validating the downside bias. This shift positions us to anticipate a continuation move.
4. Mitigation Block as Entry Zone:
We are currently watching a mitigation block for potential re-entries. These blocks represent zones where smart money mitigates previous long positions and introduces new short positions in alignment with the prevailing trend. If confirmed, they offer a strategic point to enter short trades.
Trading Plan:
Monitor the mitigation block for confirmation and look to enter with the broader institutional trend. Targets will include fair value regions and deeper liquidity pools at discount prices.
Remain patient and disciplined, and always ensure your analysis aligns with your trading plan.
Kind Regards,
The Architect

Bullish bounce off pullback support?USTEC has reacted off the pivot which has been identified as a pullback support and could rise to the 1st resistance which is an overlap resistance.
Pivot: 19,189.77
1st Support: 18,580.75
1st Resistance: 20,258.77
Risk Warning:
Trading Forex and CFDs carries a high level of risk to your capital and you should only trade with money you can afford to lose. Trading Forex and CFDs may not be suitable for all investors, so please ensure that you fully understand the risks involved and seek independent advice if necessary.
Disclaimer:
The above opinions given constitute general market commentary, and do not constitute the opinion or advice of IC Markets or any form of personal or investment advice.
Any opinions, news, research, analyses, prices, other information, or links to third-party sites contained on this website are provided on an "as-is" basis, are intended only to be informative, is not an advice nor a recommendation, nor research, or a record of our trading prices, or an offer of, or solicitation for a transaction in any financial instrument and thus should not be treated as such. The information provided does not involve any specific investment objectives, financial situation and needs of any specific person who may receive it. Please be aware, that past performance is not a reliable indicator of future performance and/or results. Past Performance or Forward-looking scenarios based upon the reasonable beliefs of the third-party provider are not a guarantee of future performance. Actual results may differ materially from those anticipated in forward-looking or past performance statements. IC Markets makes no representation or warranty and assumes no liability as to the accuracy or completeness of the information provided, nor any loss arising from any investment based on a recommendation, forecast or any information supplied by any third-party.

nas100 next move? 📈 NAS100 Market Update
NAS100 is currently trading around 19,500 and is forming a running flat wave pattern.
This structure is setting up for a potential move towards the 20,000 target.
Stay alert — the breakout could be strong!

Nas100 Diamond BottomAt the 16400 gap down the play was simple, buy, fill the gap and bullish engulf this puppy.
So it happened, and the 10 percent pump is the middle of the diamond. Then what was left to be bullish on the final retraces onto the right side of the diamond.
Now we are in. I expect exponentiaal growth, but first target is the magic average plotted on this chart.
Good luck and remember, no guarantees. I play the chart and trust it, but if it backfires thats my risk im willing to take.

NAS100 BUY Trade ideiaNAS100 Long move trade ideia. Expecting to see trade reach this target.
Please move SL to BE once it hits 1-1RR.

US100 Locking as Bullish directionUS00 Structure Looking as strong Bullish Pattern,
Forecast from Mr Martin Date 02 May 2025,
US100 Price will looking as buy side recently price will break and catch the support after push to buy side the bullish structure continue to play out the next project would be a clean rally toward the top of the channel US100 is holding its bullish structure well,
Key Level to watch
Resistance level 20,500 / 21,000
Support Levels 19,500
you can find more details in the chart of you find this idea help or learned something new then leave comments Thanks for Regarding.

X2: NQ/US100/NAS100 Long - Day Trades 1:2X2:
Risking 1% to make 2%
NAS100, US100, NQ, NASDAQ Long for day trade, with my back testing of this strategy, it hits multiple possible take profits, manage your position accordingly.
Risking 1% to make 2%
Use proper risk management
Looks like good trade.
Lets monitor.
Use proper risk management.
Disclaimer: only idea, not advice

NAS100USD: Price Respects Bearish Structure at 62% FibGreetings Traders,
In today’s analysis on NAS100USD, we observe sustained bearish institutional order flow, and we aim to align with this directional bias by identifying high-probability selling opportunities.
KEY OBSERVATIONS:
1. Retracement into Premium Resistance:
Price has recently retraced into premium pricing levels, reaching the 62% Fibonacci retracement zone—a level that often acts as dynamic resistance. This retracement also aligned with a bearish breaker block, confirming institutional resistance at that level. The market has since shown signs of rejection, reinforcing the bearish narrative.
2. Emergence of Fair Value Gap (FVG) as a Key Resistance Array:
Following the rejection, a new FVG has formed, acting as a potential short-term resistance zone. This area provides a refined point of interest where institutions may look to re-engage in selling activity. The alignment of the FVG with previous resistance adds further confluence to the bearish setup.
TRADING PLAN:
We will monitor the newly formed FVG zone for signs of bearish confirmation. Upon confirmation, the plan is to execute short positions targeting liquidity pools in discounted price zones, in line with institutional price delivery patterns.
Remain focused, wait for confirmation, and make sure this idea aligns with your overall trading plan.
Kind Regards,
The Architect

Breakout or Rejection at Key ResistanceSupport and Resistance Levels:
Resistance: 19,856.6 is a key level where the price has recently been rejected.
Support: 19,146.4 is a major support, with an intermediate level at 19,516.0 acting as a pivot point.
Trend and Structure:
The price has broken a descending trendline (white dotted line), suggesting a potential trend reversal from bearish to bullish.
Currently, the price is consolidating between 19,516.0 and 19,856.6, indicating indecision.
Indicators:
EMA 200 (Daily): The price is below the EMA 200 (19,856.0), indicating that the long-term trend remains bearish until the price sustains above this level.
Fibonacci: The 138% / 50% Fibonacci retracement level (18,950.0) has acted as support in the recent past.
Bullish Scenario:
If the price breaks and holds above 19,516.0 with volume, it could target the resistance at 19,856.6.
A confirmed break above 19,856.6 (with a close above the EMA 200) could signal bullish momentum toward 20,000 or higher.
Bearish Scenario:
If the price fails to hold above 19,516.0 and breaks lower, the next key support is at 19,146.4.
A drop below 19,146.4 could push the price toward 18,950.0 (Fibonacci level).
Recommendation:
Long Entry: Wait for a confirmed break above 19,516.0 with a strong close and volume. Target: 19,856.6. Stop-loss below 19,400.0.
Short Entry: If the price rejects 19,516.0, consider a short with a target at 19,146.4. Stop-loss above 19,600.0.
Monitor volume and price action near the EMA 200 for trend confirmation.
Note: This analysis is for informational purposes only and not financial advice. Adjust based on your strategy and risk management.

X2: NQ/US100/NAS100 Long - Day Trades 1:2X2:
Risking 1% to make 2%
NAS100, US100, NQ, NASDAQ Long for day trade, with my back testing of this strategy, it hits multiple possible take profits, manage your position accordingly.
Risking 1% to make 2%
Use proper risk management
Looks like good trade.
Lets monitor.
Use proper risk management.
Disclaimer: only idea, not advice

US100 WILL GO DOWN|SHORT|
✅US100 price grew again to retest the resistance of 20,300
But it is a strong key level
And we are already seeing
A local bearish pullback
So I think that there is a high chance
That we will see a bearish move down
SHORT🔥
✅Like and subscribe to never miss a new idea!✅
Disclosure: I am part of Trade Nation's Influencer program and receive a monthly fee for using their TradingView charts in my analysis.

NAS100USD: Bullish Scalping Opportunity from SupportGreetings Traders,
In today’s analysis of NAS100USD, we identify bullish institutional order flow, and as such, we aim to align with this narrative by seeking buying opportunities.
This setup presents a scalping opportunity on the lower timeframes, with price currently reacting to a bullish order block serving as a key institutional support zone. Upon confirmation, we anticipate a move toward the liquidity pool in premium pricing, which will serve as our target zone for profit-taking.
As always, remain disciplined, wait for clear confirmation, and manage risk accordingly.
Kind Regards,
The Architect

Nasdaq - Printing The Obvious Bottom!Nasdaq ( TVC:NDQ ) already finished the correction:
Click chart above to see the detailed analysis👆🏻
After we witnessed a minor "crash" of about -25% over the past couple of weeks, the bottom might be in on the Nasdaq. We simply saw another very bullish all time high break and retest and depite the possibility of a second retest, I am (still) extremely bullish at these levels.
Levels to watch: $17.000
Keep your long term vision,
Philip (BasicTrading)

Trendline break out NAS100## Entry
- Enter on 4H confirmed trendline breakout
- Look for retest of broken trendline as support
- Ensure price remains above key MAs on 4H
- Verify with increased volume on breakout
## Risk
- Stop below recent swing low/structure
- Risk 1-2% capital
- Size position accordingly
## Targets
1. 20000- 20200 as psychological level
2. 200 MA on daily timeframe
3. 1.5x risk-reward ratio
## Management
- Wait for clean 4H breakout confirmation
- Move stop to breakeven after momentum continues
- Trail stop as price advances toward targets
- Scale out at major resistance levels

NAS100 buy now more than 1-10RRNAS100 buy now more than 1-10RR. The Ideia I shared before is confirmed for me. Lets see

NAS100: Back in Beast Mode? Channel Top in SightThe NAS100 has stormed back into bullish territory, carving out a clean upward channel. If momentum holds, we could see price test the top again—setting up a textbook double or triple top. Here's what to watch and where this might stall.

Bearish Look for potential Reversal bearish candlestick formation upon the retest of daily supply zone.

NAS100 Breakdown Watch: Bearish Structure Forms Below Key Highs1. Key Levels
Yesterday’s High: 20,037.0
Yesterday’s Low: 19,658.8
Today’s High (so far): 19,912.4
Current Price: 19,844.4
Price is currently trading below today’s high and below yesterday’s high, but still well above yesterday’s low.
2. Structure & Market Flow
The BoS/ChoCh (Break of Structure / Change of Character) indicator marks:
Multiple BoS (green) up to the April 30th peak, showing bullish structure.
A ChoCh (red) occurred just after the top on April 30, followed by more ChoCh signals, indicating potential short-term bearish momentum.
Most recent price action shows consolidation between 19,840–19,912, forming a range after rejecting near today's high.
3. Moving Averages (3EMA)
Blue Line (Short EMA - 20): 19,843.0
Purple Line (Mid EMA - 50): 19,840.3
Price is slightly above both the 20 and 50 EMA, which are now flattening — suggesting neutral momentum with no strong trend currently in place.
4. Market Context / Price Action
The sharp rejection at 20,037 (yesterday's high) indicates supply pressure.
Price wicked above today’s high before dropping below both EMAs.
Price bounced around the 50 EMA and appears to be forming lower highs, showing bearish microstructure.
Current structure looks like a potential distribution pattern.
5. Trade Ideas (Scenarios)
A. Bearish Bias (High Probability if 19,840 breaks cleanly)
Entry: Break and close below 19,840 with volume confirmation.
TP1: 19,700 (just above yesterday’s low)
TP2: 19,658.8 (yesterday’s low)
SL: Above 19,912 (today’s high)
This setup capitalizes on a rejection of key highs, a ChoCh confirmation, and fading bullish momentum.
B. Bullish Scenario (Only if we reclaim today’s high)
Entry: Strong 15-min candle close above 19,912, targeting 20,037 and beyond.
TP1: 20,037 (yesterday’s high)
TP2: 20,100–20,150 (psychological and recent rejection zone)
SL: Below 19,840
This would be a breakout-retest continuation trade, but less favorable given current structure.
6. Bias & Recommendation
Short Bias is currently favored due to:
Repeated ChoCh signals
Price trading below today's high and rejecting yesterday’s high
Weak upside follow-through despite attempts to push higher
Tight consolidation and lower highs forming near resistance

NAS100 | 4H Bullish Breakout from Channel – Eyes on 19,970 ZoneNAS100 4H Chart Analysis
Price broke out of a well-respected descending channel with a strong bullish push. Currently approaching a supply zone around 19,970, where we may see a reaction.
Key Levels:
• Resistance/Supply: 19,970
• Support: 19,450 / 18,823
Technical Notes:
• Breakout confirmation above descending trendline
• Clean retest zone formed at previous structure (around 18,800)
• Watching for either a rejection at supply or continuation into 21,000+
Next Steps:
• Waiting for confirmation: reaction or break of the 19,970 zone
• Will look for 15m–1H entry if we get a pullback to structure

NSDQ100 INTRADAY trend change supported at 18950 Key Support and Resistance Levels
Resistance Level 1: 19590
Resistance Level 2: 20070
Resistance Level 3: 20344
Support Level 1: 18460
Support Level 2: 17820
Support Level 3: 17330
This communication is for informational purposes only and should not be viewed as any form of recommendation as to a particular course of action or as investment advice. It is not intended as an offer or solicitation for the purchase or sale of any financial instrument or as an official confirmation of any transaction. Opinions, estimates and assumptions expressed herein are made as of the date of this communication and are subject to change without notice. This communication has been prepared based upon information, including market prices, data and other information, believed to be reliable; however, Trade Nation does not warrant its completeness or accuracy. All market prices and market data contained in or attached to this communication are indicative and subject to change without notice.

Nas100 Long trade ideias. 2 possible Entry pointsNas100 Long trade ideias. 2 possible Entry points. Please wait for a brake of structure in 5min in one of these entry points. My favorite would be the lowest one but lets see.
Lets have a profitable week.
