US100 / NASDAQ#US100 BEST PLACE TO SELL FROM|SHORT🔴
📉US100 SIGNAL
✔️Trade Direction: short
✔️Entry Level: 20,101.6
✔️Target Level: 18,779.9
✔️Stop Loss: 20,975.6
📊RISK PROFILE
⭐️Risk level: medium
⭐️Suggested risk: 1%
⭐️Timeframe: 1D
——————
USTEC trade ideas

NAS100... 4h chat pattern Your NAS100 (Nasdaq-100 index) *sell setup* looks like this:
* *Entry (Sell):* 1983
* *1st Target (TP1):* 1845
* *2nd Target (TP2):* 1800
This is a *bearish trade, targeting a roughly **138-point* drop for TP1 and *183-point* drop for TP2.
To evaluate this trade, consider the following:
### 1. *Technical Context*
* Is there a *resistance level* or *reversal pattern* around 1983?
* Are *momentum indicators* like RSI or MACD showing bearish divergence?
* What does the *volume* say — decreasing on up moves, increasing on down moves?
### 2. *Risk Management*
* Where is your *stop loss*? (This is critical to protect against a reversal.)
* What's the *risk-to-reward ratio*? Ideally, aim for 1:2 or better.
* Are you risking a fixed % of your capital (e.g., 1–2%)

When the trade gives you much more than you believed was possiblStick to the plan on this one and enjoy! Doubled the move but that should have been expected since we are reaching the outer levels of price expansion.

Nasdaq analysis: 30-APRIL-2025Good morning. Welcome to today's Nasdaq market analysis and educational insights for price action traders.

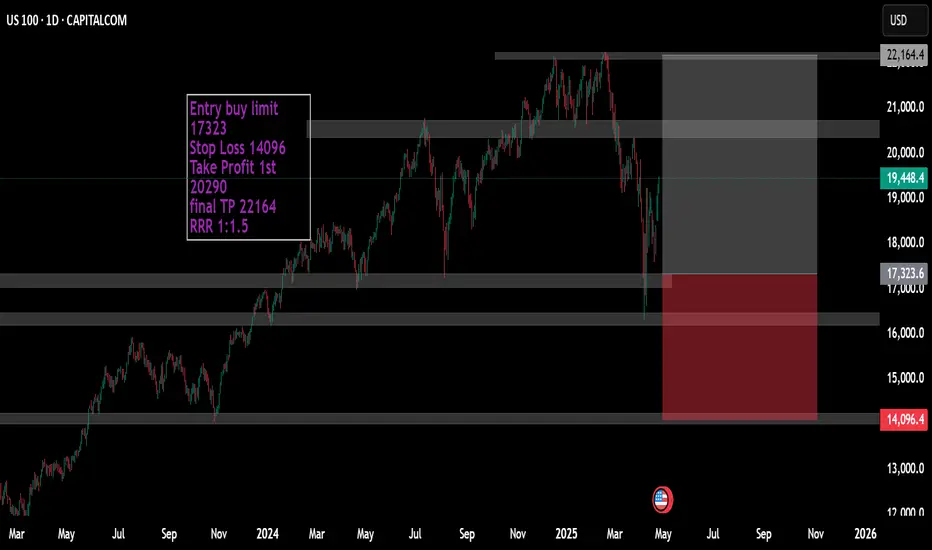
NASDAQ YEARLY CHART Chart done on 03.05.2025
Nasdaq market conditions are very similar to the 2020 market conditions
as we can see for both years we had a drop in market price for the first few month, then the recovery happened as markets started to stabilize.
this looks to be the same with 2025 as trumps appointment into the white house has caused a similar effect
for the next year nasdaq looks to be bullish so that the US economy can adapt to the new changes.
this is a very basic analysis. if a more in depth analysis is needed. Please feel free to comment

Hanzo | Nas100 15 min Breaks – Will Confirm the Next Move🆚 Nas100 – Hanzo’s Strike Setup
🔥 Timeframe: 15-Minute (15M)
——————
💯 Main Focus: Bullish Breakout at 19550
We are watching this zone closely.
💯 Main Focus: Bearish Breakout at 19450
We are watching this zone closely.
📌 If price breaks with high volume, it confirms Smart Money is in control, and a strong move may follow.
———
Analysis
👌 Market Signs (15M TF):
• Liquidity Grab + CHoCH at 19460
• Liquidity Grab + CHoCH at 19000
• Strong Rejections seen at:
➗ 19100 – Major support / Key level
➗ 19450 – Proven resistance
🩸 Key Zones to Watch:
• 19450 – 🔥 Bullish breakout level X 3 Swing Retest
• 19460 – Strong resistance (tested 5 times)
• 19100 – Equal lows
• 19500 – Equal highs
Hanzo | Nas100 15 min Breaks – Will Confirm the Next Move

Nasdaq market analysis: 28-APRIL-2025Good morning. Welcome to today's Nasdaq market analysis and educational insights for price action traders.

Is a reversal about to happen?Hello, traders
Orange circles highlight repeated price rejection and the formed doji that suggests a slowdown in a bullish wave and potential reversal. The confluence of the descending trendline and horizontal supply/resistance zone creates a high-probability reversal or breakout from this triangle.
If the price rejects again from the current supply zone and triangle, short setup toward the Fibonacci retracements or demand zones (18300 and below).
If the price breaks above the descending trendline, bullish continuation will likely target 20,000+ (Swing H).
Trend remains down.
Entry 19300
TP 18300 below
Target 14k.

NAS100 - Stock Market Waiting for a New Stimulus?!The index is trading above the EMA200 and EMA50 on the four-hour timeframe and is trading in its ascending channel. If the index continues to move upwards towards the specified supply zone, one can look for further Nasdaq short positions with a risk-reward ratio.
Last week, financial markets experienced a brief sigh of relief as U.S. President Donald Trump appeared to ease tensions by signaling a limited retreat in the tariff war with China, sparking hopes for reduced friction. However, this optimism quickly faded once it became clear that Trump’s retreat was neither substantial nor impactful.
From Beijing’s perspective, the trade war has transcended economic concerns, becoming an issue of national pride and sovereignty. As a result, China, the world’s second-largest economy, is not retreating as easily as Trump anticipated. This stance has evolved into a significant challenge for the White House. U.S. officials indicated that tariffs of 145% could be reduced within two to three weeks if an agreement is reached.
Nonetheless, according to Chinese authorities, negotiations have yet to even begin, raising doubts about Trump’s negotiation tactics. Additionally, other concessions, such as reducing tariffs on American automakers, remain uncertain, and Trump has even threatened to raise tariffs on Canadian car imports.
This environment not only fails to clarify U.S. trade policy but also deepens uncertainty for domestic businesses. Although the White House claims it is monitoring markets closely and Trump is eager to strike deals with key partners, these assurances have not alleviated concerns about the future of the U.S. economy.
In the upcoming week, critical economic data could either intensify or ease current worries. On Tuesday, the Consumer Confidence Index for April and the JOLTS job openings data for March will be released. The highlight, however, will be the preliminary estimate of GDP growth, scheduled for Wednesday.
The Atlanta Fed’s GDPNow model forecasts a 2.2% annualized contraction in the U.S. economy for Q1 2025. Meanwhile, a Reuters survey of economists projects a modest 0.4% growth rate, a significant slowdown from Q4’s 2.4% growth.
Accompanying these reports, the ADP private-sector employment data and the Personal Consumption Expenditures (PCE) index will be published. The core PCE for March is expected to show a monthly increase of 0.1% and an annual rise of 2.5%, down from 2.8% previously. Personal spending is anticipated to maintain its 0.4% monthly growth, reflecting resilient household expenditures.
Additionally, on Wednesday, the Chicago PMI and pending home sales figures will be released. Thursday will bring the Challenger layoffs data for April, but market focus will be on the ISM manufacturing PMI, expected to drop from 49 to 47.9.
The week’s main event will be Friday’s release of the Nonfarm Payrolls (NFP) report. Forecasts suggest job growth will slow from 228,000 in March to 130,000 in April, while the unemployment rate is expected to remain at 4.2%. Wages are projected to rise by 0.3%.If NFP and PCE data come in weaker than expected, market expectations for a 25-basis-point rate cut by the Fed in June could intensify, although the likelihood of a cut in May will remain low. Such data would likely be bearish for the U.S. dollar but could support equity markets if recession fears do not dominate sentiment.
Some Federal Reserve officials have suggested that if economic conditions deteriorate significantly, rate cuts could start as early as June. Currently, the Fed has maintained high rates to combat inflation but may lower them to support growth and prevent a sharp rise in unemployment if necessary.
Trump’s trade wars pose a dual risk of increasing inflation while hurting employment, complicating the Fed’s monetary policy strategy. Presently, the Fed is in a “wait-and-see” mode, but several officials indicated last week that cuts could begin if economic data worsens.
Beth Hammack, President of the Cleveland Federal Reserve Bank, told CNBC on Thursday that the Fed might lower rates starting in June if signs of economic weakening due to Trump’s sporadic tariffs appear.
Christopher Waller, a Fed Board member, stated on Bloomberg TV that he could foresee rate cuts if the labor market collapses but does not expect such a scenario before July.
On Thursday, Waller remarked, “It would not be surprising to see an increase in layoffs and a higher unemployment rate, especially if major tariffs return. I would expect faster rate cuts once signs of severe labor market deterioration emerge.”
These comments highlight the Fed’s current dilemma as it awaits clearer evidence of significant economic fallout from Trump’s trade wars.
The Federal Reserve’s mandate is to maintain low inflation and unemployment levels. Its primary tool, the federal funds rate, influences borrowing costs across the economy. The Fed can stimulate growth by lowering rates or curb inflation by raising them.
Economists warn that Trump’s tariffs present the risk of simultaneously driving up inflation while damaging employment, forcing the Fed to prioritize which challenge to address first.

Fear @ Greed Index In Nasdaq.The potential future decline of the Nasdaq index is attributed to concerns surrounding the Fibonacci level of 1.138, as indicated by the harmonic shark pattern .
At the 0.88 level, the fear index has surpassed the greed index, and it currently stands at 1.138. This apprehension is also affecting those who are typically driven by greed.

Nasdaq Top?From a topping structure point of view...
My guess is we are somewhere here today.
Will we get a C rally/bull trap?
Or maybe we fast forward to D?

US100 - Corrective Pullback into FVG + Golden Pocket setup?This 1H Nasdaq chart paints a classic structure of retracement within a bullish leg, offering potential for continuation after a clean corrective move into inefficiency. It's all about balance restoration before the next impulse.
---
1. Resistance Reaction & Local Distribution
Price faced strong rejection at a clearly defined Resistance Zone , marking a point of supply where sellers stepped in with aggression.
- The sharp rejection indicates profit-taking from earlier longs or a short-term distribution zone.
- Structure is transitioning from impulsive to corrective, suggesting a pullback is unfolding rather than a trend reversal (at least for now).
---
2. Short-Term Demand Zone Holding Price (Gray Box)
Before reaching deeper liquidity, price is hovering above a local demand block —a previously unmitigated consolidation that supported the last push up.
- This gray zone may provide temporary support, but lacks depth of imbalance.
- It's a weak floor, and smart money typically seeks deeper fills for proper re-accumulation.
---
3. Fair Value Gap Below (Primary Draw on Liquidity)
The key area of interest lies just below, where a clean Fair Value Gap (FVG) is formed. This imbalance represents a void in price action where buy-side inefficiency remains.
- Aligned with the 0.618–0.65 Fibonacci retracement range (confluence entry).
- Price is likely to seek this inefficiency for proper rebalancing.
- It’s not just a “fill the gap” play—it’s a liquidity grab where smart money is most likely waiting.
This zone is ideal for reaccumulation before resuming the move higher.
---
4. Internal Structure Suggests Bullish Intent After Fill
Price is forecasted to:
- Step 1: Break beneath the short-term demand to draw in liquidity
- Step 2: Tag the FVG zone, tapping into fresh demand
- Step 3: Shift structure via higher low formation and breakout
This is the behavior of an engineered retracement—not panic selling.
---
5. Macro Bias Still Bullish – Controlled Pullback
While the short-term price action looks bearish, the context remains supportive of upward continuation:
- No signs of aggressive selling below structure
- Current flow is corrective, not distributive
- FVG zone is strategically placed in alignment with optimal trade entry levels (OTE)
If this zone holds, expect a return to bullish expansion targeting inefficiencies left behind on the push down.
---
Conclusion:
This setup is textbook:
- Efficient rejection at resistance
- Controlled retracement into FVG with Fibonacci confluence
- Potential structural shift post-rebalance
Watch for bullish intent to return once the imbalance is filled. Until then, this is not a breakdown—it's a setup.

NAS100USD: Bullish Scalping Opportunity Within Fair Value GapGreetings Traders,
On NAS100USD, the current market structure is clearly bullish. To capitalize on this momentum, we aim to align our intraday opportunities with the prevailing trend.
At present, price has retraced into a fair value gap (FVG), presenting a potential high-probability zone for a bullish reaction. Upon receiving confirmation, this setup offers a favorable opportunity to enter long positions, with the objective of targeting the liquidity pool situated above.
Key Focus:
Structure: Bullish
Entry Zone: Fair Value Gap (retracement)
Target: Overhead liquidity pool
As always, ensure confirmation before executing any trades, and remain disciplined in managing your risk.
Kind Regards,
The Architect

NAS100USD: Bearish Continuation Likely After Liquidity GrabGreetings Traders!
As we transition into the New York session, increased market volatility is expected. Currently, NAS100USD is showing signs of potential further bearish continuation. This outlook is supported by a draw on liquidity toward downside liquidity pools and a notable inefficiency—an unfilled gap left earlier in the week.
Key Observations:
1. Unfilled Gap – A Draw on Liquidity:
The market has left behind an inefficiency in the form of a price gap, which typically acts as a magnet for price. Although such inefficiencies are not always filled immediately, they often become targets for future price movement as the market seeks balance.
2. Reclaimed Order Block Breach – Engineered Liquidity:
Price has recently broken below a reclaimed order block that was serving as a temporary resistance zone. This indicates that the market was hunting for liquidity at a relatively premium price—above a key resistance level. The presence of relatively equal highs in this area further supports the notion that this was an engineered liquidity zone.
Engineered liquidity refers to zones designed by smart money to entice retail participation. Once sufficient liquidity is gathered, institutions then drive price through these zones to execute large sell orders at a premium.
3. Downside Targets – Liquidity Pools and Gaps:
With resistance now confirmed as engineered liquidity, smart money is likely to shift focus to the downside. Key targets include liquidity pools at lower price levels and the aforementioned inefficiency, which represents an area of fair value—ideal for profit-taking and potential continuation of institutional selling.
Trading Strategy:
Monitor price for confirmation within any short-term retracements. Selling opportunities aligned with institutional intent may present themselves as price gravitates toward the inefficiency and deeper liquidity zones.
Stay focused, remain patient, and ensure all trades align with your trading plan.
Kind Regards,
The Architect

NAS100USD: Reclaimed Order Block Signals Further DownsideGreetings Traders!
In today’s analysis of NAS100USD, we observe a momentary shift into bearish institutional order flow, confirmed by the formation of successive lower lows. This structural development signals the potential for continued downside movement.
Key Observations:
Bearish Institutional Order Flow:
The consistent break of lows supports a bearish bias, providing a framework for seeking short opportunities in alignment with institutional intent.
Confluent Bearish Arrays:
Key bearish arrays—including the mitigation block and a reclaimed order block—are currently aligned. These zones, if respected, could serve as strong resistance and provide high-probability entry areas for short positions.
Trading Strategy:
Should price retrace into these arrays and provide confirmation, we can look to enter sell positions with the expectation of further downside aligned with the prevailing order flow.
Stay disciplined, remain patient, and trade only with confirmation.
Kind Regards,
The Architect

NASDAQ SCENARIO 27/04/2025English : According to our analysis, we anticipate a BULLISHscenario.
Morocan Darija : kanchofo d'apres l'analyse dyalna antsanaw TLOO3
ATENTION : I only share my ideas, not signals

Hanzo | Nas100 15 min Bullish Break– Confirming the Next Move🆚 Nas100 – Hanzo’s Strike Setup
🔥 Timeframe: 15-Minute (15M)
——————
💯 Main Focus: Bullish Breakout at 19575
We are watching this zone closely.
📌 If price breaks with high volume, it confirms Smart Money is in control, and a strong move may follow.
———
Analysis
👌 Market Signs (15M TF):
• Liquidity Grab + CHoCH at 19460
• Liquidity Grab + CHoCH at 19000
• Strong Rejections seen at:
➗ 19100 – Major support / Key level
➗ 19450 – Proven resistance
🩸 Key Zones to Watch:
• 19450 – 🔥 Bullish breakout level X 3 Swing Retest
• 19460 – Strong resistance (tested 5 times)
• 19100 – Equal lows
• 19500 – Equal highs
Hanzo | Nas100 15 min Breaks – Will Confirm the Next Move

NQ: Crumbs left to the upsideGood day!
Following the weekly analysis, here are possible movements for the next few sessions.
As I mentioned few times now, there is still small room left to the upside followed by a consolidation before resuming the down trend with the beginning of Wave 3 and its Initial Swing.
Price has already made a new HH. Price might continue up without making a new HL. But I see a HL first. GL!

Demand Zone US100 (Potential Long Play) Next week there is a nice opportunity on an identified demand zone on the US100. Due to bullish market Structure, We aim for long positions on demand zones as these are higher probabilities plays than shorts. The demand zone area is the last bearish candle (without upper wick), marked on the 1HR time frame and will be the key area of interest.

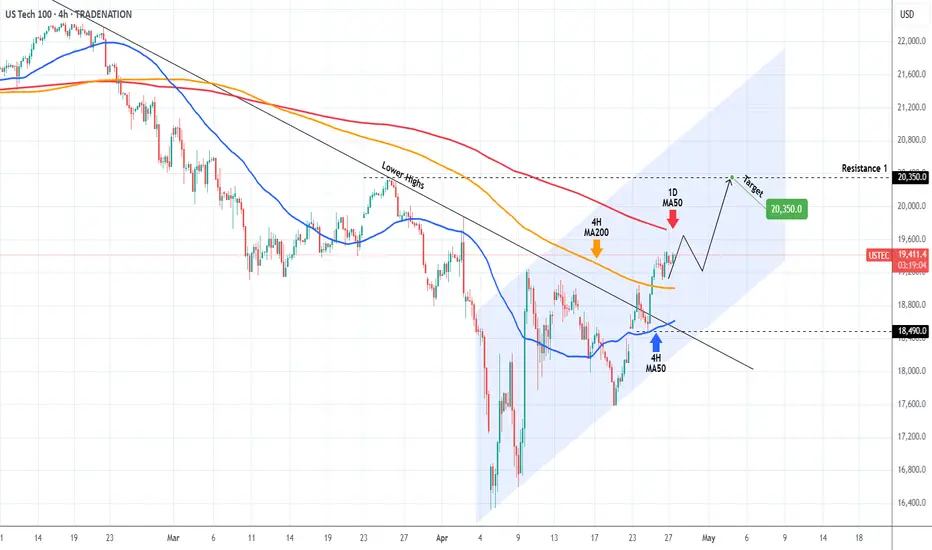
NASDAQ ahead of the most critical Resistance test.Nasdaq (NDX) not only broke above the Lower Highs trend-line of its All Time High (ATH) last week but managed to break and turn the 4H MA200 (orange trend-line) into Support.
It is now aiming for the 1D MA50 (red trend-line), which is the most crucial Resistance level of this recovery attempt and is what technically turns bearish trends into bullish if it turns into Support.
We expect a short-term rejection there, which should give a buy opportunity near the 4H MA200. Our Target for this is 20350 (Resistance 1).
-------------------------------------------------------------------------------
** Please LIKE 👍, FOLLOW ✅, SHARE 🙌 and COMMENT ✍ if you enjoy this idea! Also share your ideas and charts in the comments section below! This is best way to keep it relevant, support us, keep the content here free and allow the idea to reach as many people as possible. **
-------------------------------------------------------------------------------
Disclosure: I am part of Trade Nation's Influencer program and receive a monthly fee for using their TradingView charts in my analysis.
💸💸💸💸💸💸
👇 👇 👇 👇 👇 👇

Bullish bounce?NAS100 is falling towards the support level which is an overlap support that is slightly above the 38.2% Fibonacci retracement and could bounce from this level to our take profit.
Entry: 18,908.67
Why we like it:
There is an overlap support level that is slightly above the 38.2% Fibonacci retracement.
Stop loss: 18,461.05
Why we like it:
There is an overlap support that lines up with the 50% Fibonacci retracement.
Take profit: 20,200.53
Why we like it:
There is an overlap resistance level that is slightly above the 161.8% Fibonacci extension.
Enjoying your TradingView experience? Review us!
Please be advised that the information presented on TradingView is provided to Vantage (‘Vantage Global Limited’, ‘we’) by a third-party provider (‘Everest Fortune Group’). Please be reminded that you are solely responsible for the trading decisions on your account. There is a very high degree of risk involved in trading. Any information and/or content is intended entirely for research, educational and informational purposes only and does not constitute investment or consultation advice or investment strategy. The information is not tailored to the investment needs of any specific person and therefore does not involve a consideration of any of the investment objectives, financial situation or needs of any viewer that may receive it. Kindly also note that past performance is not a reliable indicator of future results. Actual results may differ materially from those anticipated in forward-looking or past performance statements. We assume no liability as to the accuracy or completeness of any of the information and/or content provided herein and the Company cannot be held responsible for any omission, mistake nor for any loss or damage including without limitation to any loss of profit which may arise from reliance on any information supplied by Everest Fortune Group.
