JSE TOP 40 Gap FilledOpen Gap was filled this morning. Looking for a reversal to initiate short trade.
XJSE_TOP40_CFD trade ideas

SA40 J200 2hour chart IHS pattern formingALSI top40 is making a a 2 week IHS pattern on the 2 hour chart
reward to risk 3:1

Research Report: Initial Thoughts For The Week Ahead: 27 SeptYesterday evening I published my research note for clients, covering local and offshore markets. If your interested in accessing my insights, perspectives and ideas, get in touch today.

AG Capital -Storm trading Morning Call 27 September 2021 We give a quick recap of markets overnight and the previous day and insights into the day ahead with a few trade ideas on the day. Ideas are strictly NOT INVESTMENT ADVICE.

Top40 index: mean reversion trade?A price action above 54700 supports a bullish trend direction.
RSI leaves enough room for upside price potential.
Price action in oversold territory.
At its lower range of the linear regression channel pattern - which increases the likelihood of a mean reversion trade.
Also at the lower range of the Bollinger Bands.
Might the 200-day be on the horizon as a target?

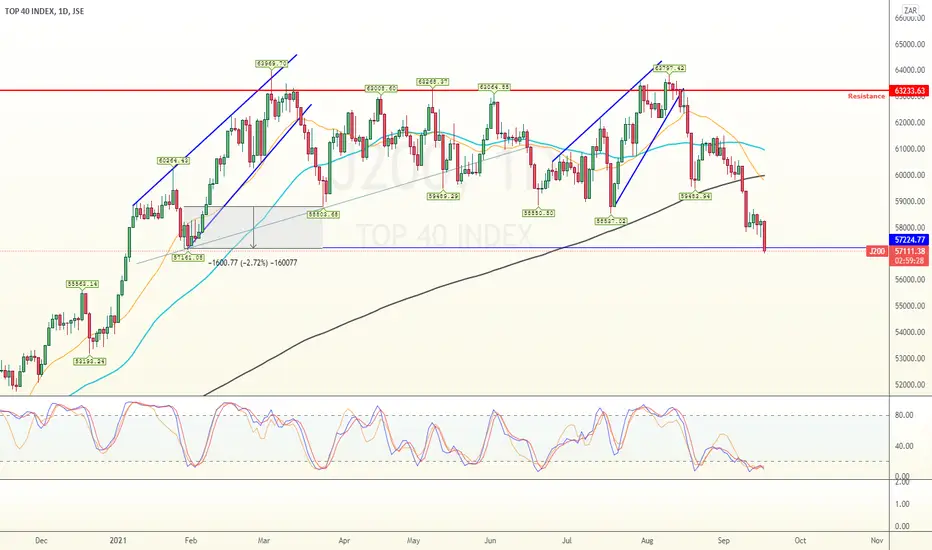
JSE TOP 40 Picture Looking ScaryAfter an almost 10% drop in just over a month in this index, I see some people already looking for entry points to go long again, as in long term. There are several technical aspects of great concern to me, pointing to something completely different. Here is a few.
• The red lines indicate that the price has now been in a bearish divergence with several indicators over a long time.
• The yellow lines show a previous downward move in indicators, but mostly a sideways movement by the price over the same period.
• My question: What are the chances of getting another sideways price movement in short succession? I have my doubts about that one.
• Most important for me to be aware of is the fact that the MACD has now turned downwards. It is a substantial distance from the zero line, and on monthly charts one does not see a change in direction of the MACD every month or two.
All in all, not a good outlook in my view, but that ties in with most indices worldwide.

TOP40 - UpdateThe TOP40 has reached the bottom of the rising wedge that formed in the beginning of the year ...
What a wild path it has taken to reached there...
AG Capital -Storm trading Morning Call 16 September 2021 We give a quick recap of markets overnight and the previous day and insights into the day ahead with a few trade ideas on the day. Ideas are strictly NOT INVESTMENT ADVICE.

TOP40- BrokenSo the Top40 broke below the 200 day moving average yesterday and there's the added bearish pattern of a well formed head & shoulders. A continuation of this pattern takes it way down. I repeat, we have 2 Bearish signals.
1. 200 day moving average broken
2. Head & Shoulders

AG Capital -Storm trading Morning Call- 2 september
We give a quick recap of markets overnight and the previous day and insights into the day ahead with a few trade ideas on the day. Ideas are strictly NOT INVESTMENT ADVICE.

AG Capital -Storm trading Morning Call 1 September 2021We give a quick recap of markets overnight and the previous day and insights into the day ahead with a few trade ideas on the day. Ideas are strictly NOT INVESTMENT ADVICE.

AG Capital -Storm trading Morning Call 31 August 2021 We give a quick recap of markets overnight and the previous day and insights into the day ahead with a few trade ideas on the day. Ideas are strictly NOT INVESTMENT ADVICE.

AG Capital -Storm trading Morning Call 27 August 2021We give a quick recap of markets overnight and the previous day and insights into the day ahead with a few trade ideas on the day. Ideas are strictly NOT INVESTMENT ADVICE.

2000 Points on the Table for JSE Top40SATop40 Likely to see correction in the week ahead and this week showed a possible rejection of 63800 area.

AG Capital -Storm trading Morning Call 20 August 2021 We give a quick recap of markets overnight and the previous day and insights into the day ahead with a few trade ideas on the day. Ideas are strictly NOT INVESTMENT ADVICE.

AG Capital -Storm trading Morning Call 18 August 2021 - TENCENT We give a quick recap of markets overnight and the previous day and insights into the day ahead with a few trade ideas on the day. Ideas are strictly NOT INVESTMENT ADVICE.

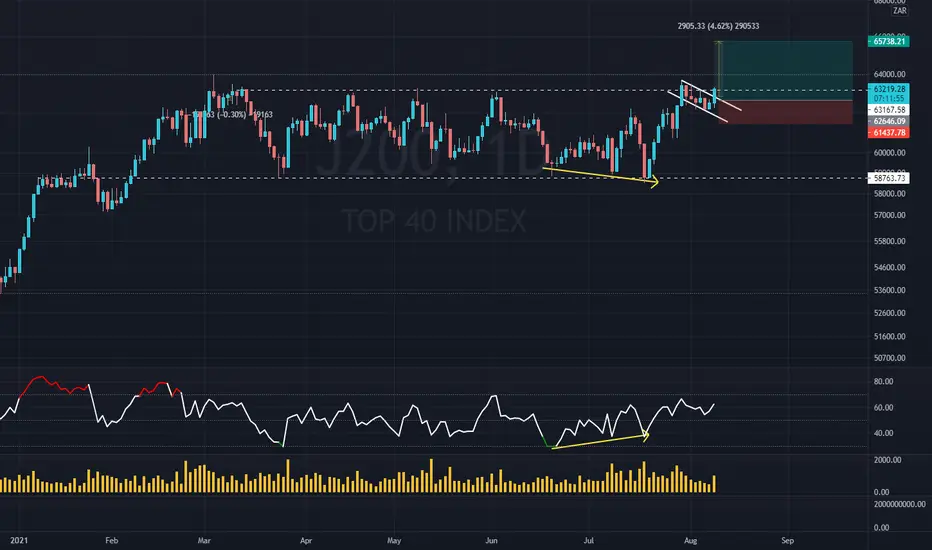
ALSI/j200/TOP40 daily chart bull flag breakoutALSI/J200 held support into the 59000 mark with positive RSI divergence 2 weeks ago,
Right now we it is trading at the upper end of this year long consolidation with a Bull flag breakup happening today
A close above 63000 today confirms the breakout.
Reward to risk 2.5 : 1
J200In-between the major range that has been running for months we may well be seeing a medium term market top (which many have been calling for with inflation fears and Chinese regulators clamping down) in the making... Are we seeing a crude megaphone pattern forming?

J200The J200 has been quite lackluster for a while now, it is still rangebound between +/-59000 and +/-63000. 62000 has been capping gains quite aggressively and is a very important level. It remains a sit and wait type of market for now, this coming week or so may well give it some direction.

Main view, Range tradeMain view on J200, range stays intact unless a daily close below 59000 occurs, high risk to reward long here in the buying zone targeting +/- 63000

SOUTH AFRICA TOP 40 INDEX -30- TVC Profitable Deals Not a Lot Of Indicators
Good Analyse = 85% Easy Money
You can text me for a business

TOP 40 INDEXJSE -1D- J200 Profitable Deals Not a Lot Of Analyse And Indicators
Good strategy = 80% Easy Money
You can text me for a business.

Great Long in South-Africans Stocks IndexImportant breakout of the daily resistance and range. A bullish continuation pattern is expected to 1st TP and 2nd TP
