J200This note is an extract from my weekly research report
JSE Top 40 - Skyscraper View - Strong But Not Overbought | Stepping back, we continue to note the index making a fresh break of the 3 year sideways consolidation and more broadly, continuing to shift to the upside of a 7 year consolidation. While the index is just over 77% off it's March 2020 lows, the technical indicators suggest a 'strong but not overbought' position with the monthly Relative Strength Index at 64 and pointing up, suggesting room to advance. Note the price having held the pivot and head toward 'resistance level 1'. Monthly Chart.
XJSE_TOP40_CFD trade ideas

SHORT SA40 on the hourly chartHey guys, South African top 40 index looks like its reversing to the downside.

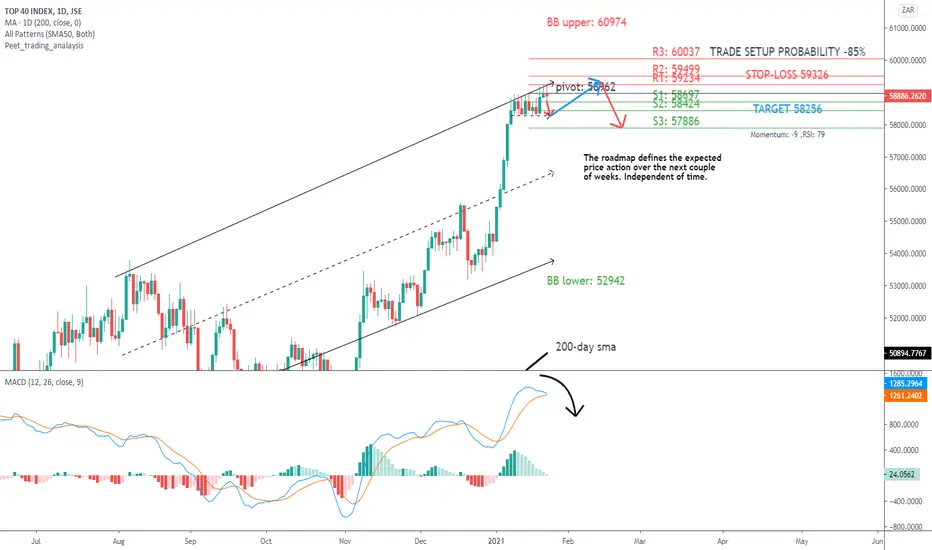
Top40 index: a correction on the horizon?An overbought BEARISH bias is applicable below 58962.
Trade setup probability: -85%. Target: 58256. Stop-loss: 59326.
Downside price momentum supports the bearish trend direction. RSI is at 79 (extremely overbought).
High probability trading is a good starting point but you must also consider some other important metrics to help maximize your profitability.
A higher positive probability percentage supports a bullish trade setup, whereas a higher negative percentage supports a bearish trade setup.
JSE Top 40 Index - Emerging Weakness The index current trades with a 'strong' but 'near overbought' ranking, with the daily Relative Strength Index looking to cross down from above 70.
The underlying time frames (4H and 8H) signal a weakening trend, with the Relative Strength Index in a downward trend (upper panel).
The price is currently capped at 'resistance level 3' which has held since 08 January 2021
The price currently trades 15% above it's 200-day.
Fresh long should exercise caution.
Stop: 59300

Weekly game plan 17 Jan 2021 - ALSITight range on the 1 hour chart offering a great risk-reward trade once the range breaks. Wait for the break of the range and trade in the direction of the break. Our bias is bearish.

JSE Top 40JSE Top 40 Index | The trading range on the index has been very range-bound over a 5-day period, with narrow candle structure reflective of a sellers resuming their activity following the prior 5-day advance (04-08 January 2021) where buyers were in clear control. With weakness being seen in the United States on Friday, it raises the potential for follow-through to the local market which is sensitive to global developments. Having been rejected at 'resistance level 3', a print below 58290 would trigger a reversal of the recent upward trend. We also note the price now trading outside of the steep incline support in place since 04 January. In terms of the technical indicators, the 7-day Relative Strength Index (RSI) is looking to cross below the 14-period RSI, a sign of near-term weakness.

JSE Potentially Starting to Outperform the S&P500?After the recovery from the Covid lows, the JSE has been underperforming the S&P500. However, since the start of the year, the JSE has been outperforming it. However, the low holiday volume should be taken into account. However, the start of the year could indicate where the JSE is at.

JSE Where are we at?Starting 2021 we find that the recovery from the Covid lows is still in progress. After a pullback and low formed in October 2020 we are seeing another push higher. Resources are again showing the most strength with a nearly 40% rise. However, financials are also recovering well at this stage but industrials are lagging. Over the holiday period, we have seen a push higher on lower volume but now we are finding a shoring of the stride. Watch for the next pullback in 2021 for the next opportunities.

JSE TOP 40 Channel BoundIt seems as if the index has avoided the bottom of the channel on the 240 min chart one more time, but with an ever growing divergence with the RSI, I suspect that cannot continue too long. Top of the channel now above 56000.

SA40 Growth -SND ForecastPrice broke away from the ranging area of 47500 - 52500. It had a sharp turn at level 34600 making it a demand area at 40000.
Then a demand Low was finally formed at 48000 turning that area range into a demand zone that has an in-demand support line for the HL at 52000.
The current Low's unit value is the RSI 56.22.
Bias 65860.51
Next potential resistance is 62003.08
The open price is 60000
K.
At this profile page, the shared analysis, ideas and also, the strategy of a chart belong to Khiwe. The technical set-ups are speculative, they are not guaranteed for accuracy or in completeness in the form of any content; -it is not to advice on financial markets. Please apply your own analysis and confirm it with price action.


The top 40 looking good for all time highsA nice bullish rectangle flag on the top40. Looking good to make new highs

South African Top 40South Africa s' rand retreatsas weak data hits buying,stocks stable
South Africa s' rand retreated on Thursday, putting a hold on a rallythat took it near a 10-Month High as weak local data dampened buying,while stocks were mostly unchanged.
at 1557 GMT, the Rand Zar =D3 traded at 15.0100 versus the dollar, 0.33 % weaker than its previous close. the Rand touched its best level from Mid February this week as global risk appetite lifted demand for the currency.
But the data showing Manufactoring output fell 3,4% year-on-year in October While Mining Output dropped 6,3% tempered investors enthusiasm. Retails sales data published on Wednesday also showed a decline, down 1,8 % year-on-year. Government Bonds yield Zar 2030= were flat at 6,930%.
Stocks were stable with the 3,1 % drop in the banking Sector ,JBANK weighing on gains. the Johannesburg benchmark all-share index ,JALSH dipped 0,02% to end at 59,283 points. Group MTNJ.J fell 3,5 % after Nigeria directed all Telecomunications firms to stop selling sim-cards while it audits rule compliance. Stocks JGLDX firmed 3,41% as the Rand weakened , with Harmony Gold HARJ.J closing up to 2,26 % at 64,65 Rand. South Africa gold miners benefit from weaker currency, as their revenues are often in dollars, while costs are in Rands.
So looking at where the JSE-ALL Share index stands we expect the Market to decline in the next upcoming months.
Analysis with Entries...
SA 40 (South African Top 40
Sell Now
Take Profit 1 @ 53 865.3
Take Profit 2 @ 53 418.6
Take Profit 3 @ 52 995
Take Profit 4 @ 52 533


#ALSI Bull flag breakout retestALSI saw a decent sell off today. This has resulted in a retest of the recent flag breakout. This support level needs to hold, or it could result in sell off momentum building it breaks back into the flag. A bounce is expected off this level.

J200 Top 40 Index . Bull flag breakLooking very bullish flag break today with 53800 and 55200 (All time high) targets.

Sell Limit!Price just cant seem to close above the 53 000 level on higher time frames and it has tried numerous times. When price tries something and fails multiple times it will often go the opposite. So i am taking a short on this index on the 1h time frame. Here price is already trading under the Kijun,which is above the tenkan (bearish signal). The cloud is thick so it will probably need a momentum move to penetrate it. The lagging span has a better passage down than up. The stop is is just above the kijun resistance. This increases R but we could also get stopped out,the risk is worth the reward. The trade is a sell limit,so i anticipate price will temporarily go up again and test the kijun zone thereby triggering the trade then from there plummet.
Sell Limit Entry: 52 591
Stop Loss : 52 848
Take Profit : 51 402
R : 4.62

#ALSI Big consolidation breakRubbing the crystal ball here a bit, but big breaks like the ones we've seen on the ALSI usually gets tested at some point in time to confirm the bullish sentiment. Last week was a 10% week for ALSI + an additional 1% today. Expecting some consolidation in the near future. Market is very bullish at the moment.

J200 Top 40 Index .Headed for the top of the channel ? Are we headed for the top of the channel once again ? Be prepared for some volatility during the US presidential election period.

#ALSI JSE ALL Share Index - Bottom of channel supportThe question now is if support will hold. If it does, we should see a little bounce from here.


JSE:200 JSE Still Getting WeakerI have not posted for some time but am looking to post more regularly again. After the covid shock, we have basically been trading in a range. Using a Wyckoff view this is expected after a selling climax. The question is now where are we in the trading range and are we seeing a redistribution or accumulation? Starting off with a comparison of the Top 40 against the S&P500 we see that the JSE has relatively been in a downward trend since 2016. However, the resources sector has been in an uptrend relative to the rest of the Top 40. After the covid drop resources have also recovered well. The financial sector on the other hand has not seen any rebound effect and remains at the low levels after the drop. So following strength, it is wise to focus on the resources sector when looking for a recovery.
