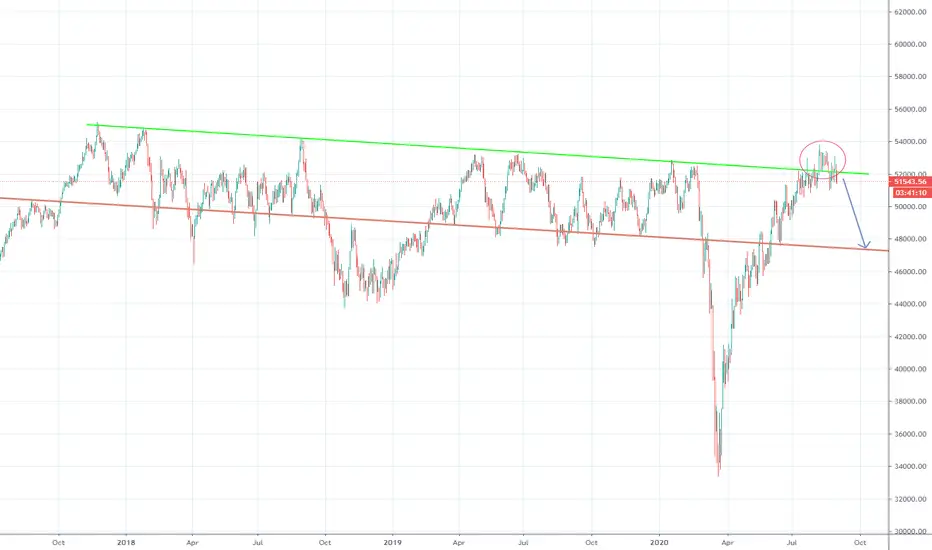
CAUTION AHEAD!Caution ahead as price rejected 51300 trendline resistance of the falling wedge. On weekly chart the Index printed a Doji candle indicating potential reversal.
XJSE_TOP40_CFD trade ideas

$J200 JSE TOP40 Index. Open air belowIf this down channel is anything to go by then there is some downside risk on the TOP40 Index in coming days, weeks. Trade with caution.

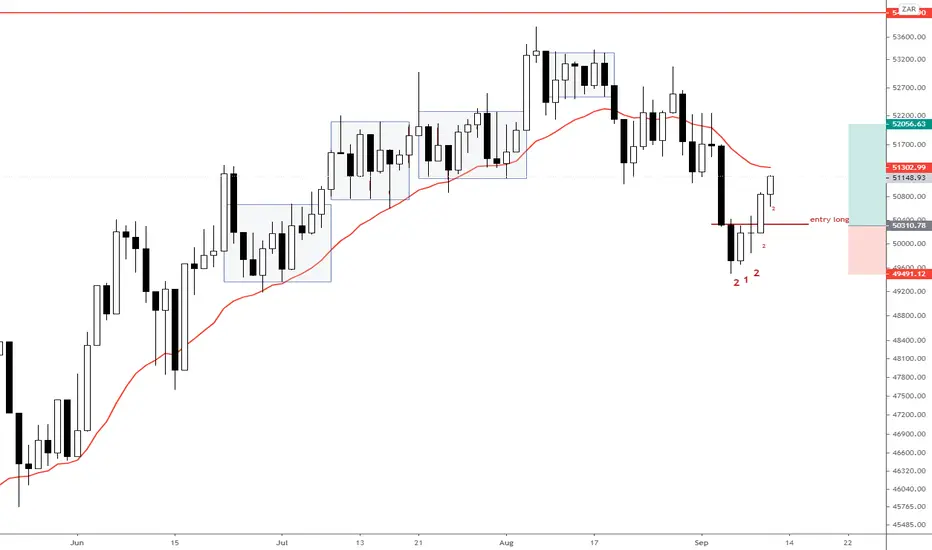
SA Top40 The SA Top40 index has been facing alot of resistance lately due to the current pandemic and political climate. The SA president recently announced that they will ease the lockdown to level 1. Good news for airlines (and tourism sector) as international borders are open and more businesses will hopefully be able to resume. This should boost investor sentiment in the short-run.
However, the index is structured in key levels/zones and recently has a strong downward trend. Thus, setup 1 or 2 can be expected. Wait or clear breakouts and retests confirmation to play it safe.

Descending triangle pattern Top40 indexWe have a descending triangle pattern on Top40 a break above 50700 resistance could potentially see us hit all-time highs at 55k levels.

J200 (Top40): aiming higher?💡 A sudden bullish bias is applicable above 50173.
Pivot point (trend change) at 50173 and hence is a bullish bias applicable.
Upside target (most likely): 51610.
Downside target (least likely): 48735.

JSE Top40 Index. Channel within a channelIf the smaller channel break to the upside we could see a 1200pts move to a test of the upper resistance line of the larger channel. Expecting some upside.


JSE T0P40I initially predicted a 17% decline on JSE TOP40, the move is well in motion. See link below
South Africa has had one of the worse lockdowns in response to covid19 and it resulted in a reported decline of 51% in GDP. The unemployment numbers and number of business bankrupted are not yet publicly available. South Africa also increased its USD debt during this crisis and in a lot of ways money meant for economic recovery was lost to corruption. During this period there's also been increases in social grants and introduction of new ones despite the decrease in production.
When more of the data becomes available i think the stock market will keep falling further, though i doubt new lows could be made, but i am very convinced the we could see prices falling to a range of about 34,000 - 35,000.
Share your thoughts in the comments below
Like and follow for more content
Link in related charts
Good Luck!!!

Top 40 (J200)The index has continued to trend lower, with a 4-day decline following the rejection at the aforementioned downward trending overhead resistance. On Thursday, the 8/21-EMA was breached with a large bearish igniting candle. Considering Friday's US close, the 50224 level is vulnerable to being breached which opens up 49686 as a target. If we do see a rebound at the open, combined with an intraday rebound then the 8-EMA could act as a resistance level.
This chart forms part of a larger research report and should not be viewed as a recommendation to buy/sell.

Top 40 - J200On Tuesday we saw the index test our distribution zone and sell off following a long upper wick that developed at the downward trend line resistance. Today the index continues to sell off with the price breaking the 8/21/50-EMAs with a large (igniting) red candle. From an ultra short term tactical perspective, the 50250 zone may not hold, however we want to monitor ~49570 as a potential accumulation zone (for an overnight or intraday bounce). This is close to the horizontal support of 18 June to 02 July and the 04 September as well as the 200-EMA. It should be noted that the current setup carries a bearish with the RSI below 50 (current reading 44) and the MACD below the zero bound.


#ALSI All Share Index Some bearish signalsAlsi is consolidating after the V- Shape recovery. A potential head and shoulders formation is building that could see the index drop by another 3-4%. Keeping an eye on the neckline for a test and break.

#ALSI Back into channel.After spending a few days above the channel the ALSI has now broken back into this channel and could be heading lower in the medium term to test the bottom of this channel once more.
SA 40/SOUTH AFRICAN 40 LONGITS NEVER BEST TO TRADE IN THE BEGINNING OF ANY MONTH, BUT IF A SETUP AVAILS I TRADE WITH PROPER RISK.
HERE IS SA40 OVER TREND WAS BULLISH FOR THE MONTH OF AUGUST AND WHAT WE HAVE IS CORRECTION NESTED ON DEMAND, LONG SA40 WITH 2% RISK RATIO.


Relative Performance of SA40 vs select global ETF's (Weekly)The relative performance of SA40 vs Satrix Nasdaq 100, Sygnia 4th Industrial Revolution, Sygnia S&P 500 and Sygnia MSCI World.

#ALSI JSE ALL Share Index - Cool new features in TradingviewTradingview has now added candle stick patterns. Very nice feature that points out things like engulfing candles (BE) , doji's (D), hammer candles (H)etc. ALSI is currently in a very precarious spot. It has broken through a long term resistance line, but is showing some bearish signals above this break. Not a very convincing break. Wait and see approach for me.

The SA top 40The SA top 40 has tested the trendline 6 times a break of this trendline must be watched with caution. the trend is getting old

#ALSI JSE ALL Share Index - Cautious approach Quite a curve on the ALSI like many other indices in the world. We could have reached double top that also coincides with the high in January 2020. Caution is advice in taking new long positions at current levels over the next few days.

Resistance Reached for Top40; Correction on the CardsTop 40 formed a bearish reversal last week.
For the past 3 years it has been trading within a range and has now reached the upper end of that range.
There is a high probability that in the next weeks and months it will test the lower end of the range starting with 49000 then 44000.
RSI Testing 60 which has been a turning point historically as illustrated.

Resistance Reached on Top40; Correction a high PossibilityTop 40 formed a bearish reversal last week.
For the past 3 years it has been trading within a range and now has now reached the upper end of that range.
There is a high probability that in the next weeks and months it will test the lower end of the range starting with 49000 then 44000.
RSI Testing 60 which has been a turning point historically as illustrated.
