VELO at Major Turning Point?### Importance of the 145-Day Cycle:
1. **Intermediate Cycle**: The 145-day cycle is often viewed as an intermediate-term cycle. It can help traders identify potential turning points within a larger trend¹.
2. **Market Timing**: Gann believed that markets move in predictable patterns and cycles. The 145-day cycle can be used to time entries and exits more effectively by anticipating when these turning points might occur¹.
3. **Repetition and Symmetry**: Gann's theory emphasizes the repetition and symmetry of market movements. The 145-day cycle fits into this framework, providing another layer of analysis for traders looking to understand market behavior¹.
### Application in Trading:
- **Chart Analysis**: Traders often mark the 145-day intervals on their charts to look for patterns or significant price movements that align with these dates.
- **Confirmation with Other Indicators**: The 145-day cycle is usually used in conjunction with other Gann tools, such as Gann angles and the Gann Fan, to confirm potential support and resistance levels².
- **Historical Data**: Analyzing historical data to see how the 145-day cycle has influenced past price movements can provide insights into future market behavior².
### Example:
If a stock has shown significant price movements or reversals around the 145-day mark in the past, traders might anticipate similar behavior in the future. This can help in planning trades and managing risk.
### Conclusion:
While the 145-day cycle is not as universally recognized as some of Gann's other cycles, it can still be a valuable tool for traders who incorporate Gann analysis into their strategies. Its importance lies in its ability to provide additional insights into market timing and potential turning points.
VELODROMEUSD trade ideas

VELO Retrace to the 618VELO has retraced to the 61.8% level after a significant downtrend, the bounce comes with increasing volume, and might be a good time to consider entering a long position. If the price breaks below this level with high volume, it might be wise to reconsider and possibly look for short opportunities. When a chart retraces to the **61.8% Fibonacci retracement level** after a significant downtrend, it often indicates a potential reversal or continuation point.
Here’s what you can typically expect and how to interpret this scenario:
### Potential Scenarios:
1. **Reversal and Uptrend**:
- **Bounce Back**: The 61.8% level is a key Fibonacci retracement level and often acts as a strong support. If the price finds support here, it may bounce back, indicating a potential reversal and the start of a new uptrend.
- **Bullish Signal**: A strong bounce from this level, especially with increased volume, can be a bullish signal. Traders might look for confirmation through other indicators like RSI or MACD to enter long positions.
2. **Consolidation**:
- **Sideways Movement**: The price might consolidate around the 61.8% level, moving sideways as the market decides its next direction. This period of consolidation can be a sign of accumulation before a potential breakout.
3. **Continuation of Downtrend**:
- **Failure to Hold**: If the price fails to hold above the 61.8% level and breaks down with strong volume, it could indicate a continuation of the downtrend. This would be a bearish signal, suggesting further declines.
- **Bearish Signal**: Traders might consider short positions or exiting long positions if the price breaks below this level, especially if confirmed by other bearish indicators.
### Key Considerations:
- **Volume Confirmation**: Look for volume spikes to confirm the strength of the move. A bounce with high volume is more reliable than one with low volume.
- **Other Indicators**: Use additional technical indicators like RSI, MACD, or moving averages to confirm the signal from the Fibonacci retracement.
- **Market Context**: Consider the broader market context and any fundamental factors that might influence the price action.

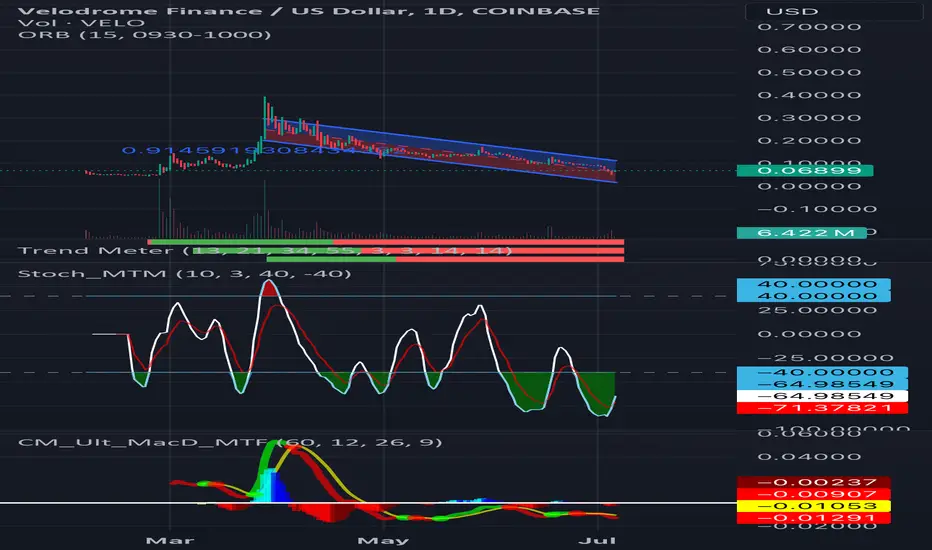
VELO USDT to $0.13Long accumulation phase on the DAILY timeframe that could potentially break out.
This recent formation of a descending wedge pattern suggests significant potential upside for VELO.
The breakout from such a pattern is often a precursor to substantial price movements.
Generally, the higher the timeframe of the breakout, the larger the potential move.
We observed a similar scenario with AERO. We entered AERO when it was in a similar pattern and caught the breakout that propelled it upward, allowing for significant gains.
Target: $0.13 (with higher potential beyond)
--------------
Why $0.13?
VELO has a maximum supply of 1.8 billion tokens, with approximately 800 million currently in circulation. Presently, the market cap stands at $73 million, with a fully diluted valuation (FDV) of $166 million. The potential for VELO to reach $0.13 represents a realistic target that would elevate its market cap significantly.
Velodrome Finance is not just another DeFi project; it serves as a liquidity and yield generation platform that operates across multiple chains, including Optimism (OP) and others. It provides a robust ecosystem for decentralized finance, featuring ample liquidity and yield opportunities.
Similar to AERO, which also formed a descending wedge pattern, VELO could potentially break out and claim the 200 DEMA. If this occurs, it could take VELO toward $0.13, which aligns with the 0.236 Fibonacci level on the daily chart. Importantly, $0.13 is just the first target, and there is potential for further gains beyond this level as the project continues to develop and attract attention.
VELO's presence on Coinbase adds to its credibility and market visibility. As we look ahead, the substantial liquidity and yield generation opportunities available through VELO appear underappreciated, leading to the strong possibility of a 10x return in the future and perhaps even more.
Achieving the $0.13 target would position VELO more favorably in the market, increasing its market cap to a more substantial figure. This target reflects a conservative estimate, considering the project’s fundamentals and its current market conditions.
It’s important to recognize the inherent scarcity of VELO's token supply, which makes it susceptible to significant price pumps. While there is potential for VELO to surpass $0.13, this target serves as a prudent benchmark for the near term.
Velodrome Finance is committed to fostering a decentralized finance ecosystem, providing infrastructure that supports liquidity and yield generation for various applications. It aims to redefine how users interact with DeFi, making it a noteworthy project to keep on your radar.
VELO has been a key focus of mine for some time, and I’m excited to share my insights as we monitor its potential journey toward $0.13 and beyond.
COINBASE:VELOUSD OKX:VELODROMEUSDT CRYPTO:VELODUSD MEXC:VELODROMEUSDT GATEIO:VELODROMEUSDT COINEX:VELOUSDT BITMART:VELOUSDT

VELO ready to break out?VELO has made it through a major resistance zone and is now sitting in a zone of relative interest. If we can break above this zone, we are likely going to .10-.12 or higher.

VELONot expecting any positive PA till later this year of maybe early next year. It would be nice to see this range hold with a potential BO to the upside. With VELOs MC so low I still think this is a great time to purchase and HODL.

VELOA breakout at this point with such a low MC could be where we see this thing start to turn around at. The entire ALT space has taken a beating but VELO is OPs number one DEX with ALOT of potential upside. Fingers crossed with ALT can see some crazy moves.

VELOWay way down from its ATH. Is the bottom in, this can be asked for the entire digital sector, yea that's right i said it, sector.. Who knows WTF is going on? I thought we were in a EFFing BullRUN.. Someone lie to me and tell me that we are! WTF is going on with the OP network?? At least BASE will always have its back and OP will always be on BASE as an avaliable NETwork. HOE, suppose to be the number one DEX on OP and VELO is REKT... with such a LOW MC. UNDER 100M.

$VELO - at initial ICO priceVolume increasing but not strong enough to break the downard trend yet. Entered the bullish divergence channel after the bitcoin drop. This and its all time low are buy points.
Not trade advice
VELOI think everyone in digital is asking themselves, where is the bottom? As VELO ReTeST the botton of this range, I PRAY the bleeding on my position STOPs.


VELODid see this coming, Hopefully VELO is able to find some support at these levels . With a market cap that has gone down 50% you would think this would be a great level to accumulate, but the markets are so unstable at the moment I am going to sit on the sidelines a watch what happens.

#VELO 21% Hot Setup, Deep Falling wedge = Lofty Targets VELO 21% Hot 🔥🛗🔥 Setup
#VELO 21% Hot Setup, Deep Falling wedge = Lofty Targets

Velodrome to $1Velodrome to $1?
Velodrome currently trading at $0.13.
Falling wedge with bullish potential.
Stoch Rsi = Bullish
Rsi = Neutral > Bullish
Macd = Neutral > Bullish

Velodrome Bullish WeekVelodrome Bullish Week?
Falling wedge from $0.39 to $0.12.
In a bull market potential to reach billion marketcap.
Price: $0.139
Marketcap: 92 million
Stoch Rsi = Neutral
Rsi = Neutral > Bullish
Macd = Neutral > Bullish

Velodrome bullish weekBullish week for Velodrome
Current price $0.15.
Lots of potential to reach $1 and higher.
Rsi = Bullish
Stoch Rsi = Neutral > Bullish
Macd = Neutral > Bullish

VELOGotta be patient, but I think VELO is in a great place. When it moves it MOVES. Market-cap is so low. We are at a critical point where itll be big swings up or down, with where we are in the cycle there is just no telling.

VELOVelo has held its support. With an even lower market cap things are looking up. If ALTs move DEXs in general will do great because of the volume. I expect more distribution at these levels until the next leg up, but im thinking that next leg will be sooner then we can expect if BTC can behave itself.

VELOVELO has been able to maintain a market cap above 100M. From what the charts tell us, we have alot of distribution and sideways action ahead. This is healthy consolidation IMO. Still early for VELO. A 500MC makes sense for this project being OPs DEX of choice.

VELORetest of the prior support here in the near future. Expect us to CHOP around here, get rejected, then maybe push its way thru, without the volume it wont happen..

Velo-DailyDown 60% from it ATH, broke right thu its previous ATH, there is hope that we could be seeing a bottom. VELO is my largest bag with hopes that its low market cap can reach 1B although I do think this project can reach much higher along with AERO.

VELO 4hrLooking at what appears to be bullish D on the 4 hr. With BTC steadily heading downward this might not play out. Either way VELO at this low of a marketcap makes sense to DCA in at these levels.

VELOLooking at the daily, we are approaching the 50ema which is a great line of strong support marked with great entry points. My largest entry sits at around .25cents, at this point of the cycle we are seeing lots of distribution in the ALTs with what look like more negative price action for the rest of the month. VELO and AERO are both solid projects to load up on while we continue to see dips in the market.

Velodrome Bullish MonthVelodrome Bullish Month
Current price $0.22
All time high $0.39
Marketcap 130 million
Stoch Rsi = Bullish
Rsi = Neutral > Bullish
Macd = Neutral > Bullish
