Very Bullish Vechain & ETH based ALtsSeems like xrp and solana stole the show. time to bring it back to OG alt szn
VETBTC trade ideas

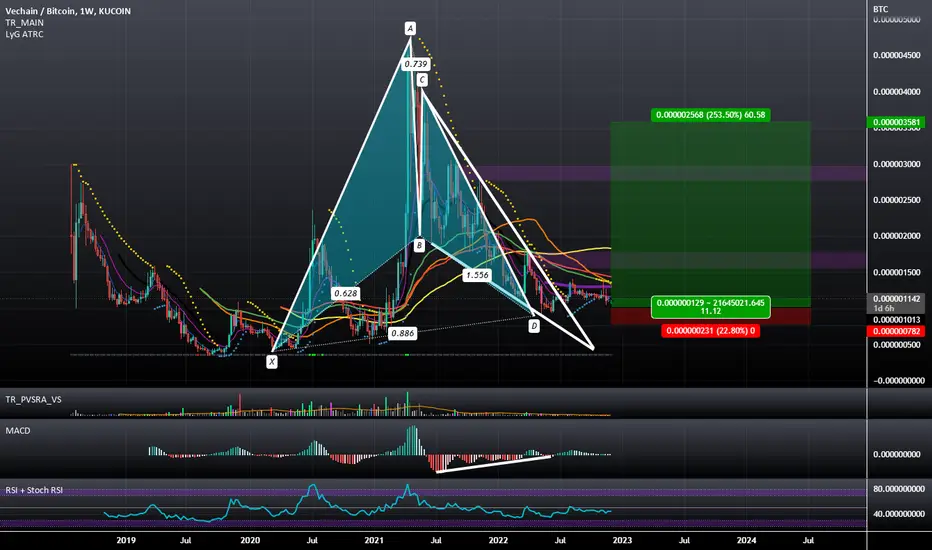
Vechain Opportunity: Lowest Price In 5 Years —Accumulation PhaseGood afternoon my fellow Cryptocurrency trader, I hope you are having a wonderful day.
Something amazing is happening here with Vechain, VETBTC. Right now this pair is trading at the lowest price ever, which is the lowest since September 2019, more than five years ago.
The exact same price, back in 2019, around 340 satoshis (0.00000340), marked the end of a bearish wave and the start of a major bullish cycle. Every end is the start of something new.
The previous bullish cycle developed in a series of three waves with each wave being many times stronger than the previous one. Total cycle duration was 595 days with a total of 1,291% growth from bottom to top. This is all pretty amazing.
Looking at the chart, we can see that there was a clear opportunity to sell at the top of each wave and buy back lower. There was plenty of time to sell on the way up or on the way down, and plenty of time to buy again at the wave low/support or when the bullish action was again being restarted.
The situation is similar now. This is an opportunity that does not repeat very often.
VETBTC is trading at bottom prices, just think late 2019, and soon will enter "wave 1," the first strong wave of the bull-market.
We are projecting/predicting a bull-market for 2025, most of the year and an end the same year but it can extend. Who is to say that the bull-market won't go into 2026 or even longer? This can happen because of how monetary policy is now changing toward easy money and now Cryptocurrencies are becoming more available and accepted across the world. There is always the possibility of the unexpected happening and a super mega bullish cycle developing in accordance with the evolution of the human race, technology and money. Just as the Internet changed the world, Cryptocurrency is changing money. Imagine a new uptrend develops that goes on and on and on just as it happened with the technology stocks.
Ok. Such scenario wouldn't affect all the pairs equally and we would still have corrections. Since Bitcoin would be strong also then the BTC pairing on the Altcoins market would have to undergone unknown price dynamics, but the future is bright for our space. The future is bright for Crypto. The future is bright because humans as a whole are waking up.
The bear market for VETBTC lasted 1,246 days. Counting the 16-September 2024 All-Time Low (0.00000335) as the bottom. This is a very long time based on any standard for this market.
Knowing this, we can start the accumulation phase. Accumulation refers to buying with the intention to continue buying in order to hold long-term. You can't go wrong.
If prices drop, just wait.
If prices rise, just wait.
Buy as much as your finances permit; that's the accumulation phase.
The worst case scenario is a long wait.
We can see this and we are prepared.
Since the bear market is already on for more than 3.5 years, and we see the activation of a 5 years long support, we don't have to worry about a long-term drawn-out bear-market because we are looking at a true bottom and thus the next major trend will be up.
We saw a downtrend and so we get an uptrend next.
An uptrend is defined by higher lows and higher highs... Once you are in and in the green, you have a successful trade.
It can be life changing if we take action and hold strong.
If you are reading this now, you must be really smart, lucky, prepared, a genius or a combination of those, because normally people tend to become aware about these projects at the top which is the wrong time to be bullish, just like it happened for many in March 2024.
But this is not March.
It is already October and prices are really low.
Buy low is what I say.
Buy at the bottom.
Buy near support.
When prices are high up and near resistance, that's the time to sell.
When prices are hitting new All-Time Highs, that's the time to trim your position and secure profits.
When prices are high, think short-term.
When prices are low, buy and hold, focusing on the long-term.
Are you ready for 2025?
We will have the biggest bull-market in years... It will be the most amazing bull-market the Cryptocurrency market has ever seen. It will be something for the record books because the market has never been this big before. The market has never been this big and this is the first time that Cryptocurrency is open and available to the whole world.
There will be many millionaires coming out of this cycle, are you going to be one of those?
Prepare yourself and work hard.
Money is endless. There is no limit to how much wealth is available in the world.
The only limitations are those we create with our thoughts.
Hope for the best, prepare for the best and you will get what you want.
Namaste.

VET Steep Decline Leads To Bullish Jump (100%+ BU-Pot)Coming off a top from February 2024, VETBTC produced a very strong/steep decline and this is good.
The main low/support was established late October/November 2023; the steep decline pushed prices deep below this support.
👉 A strong recovery, and fast, is very likely due to this lower low.
👉 We have some early bullish action; the targets are on the chart.
👉 If there is another drop; buy more, accumulate and hold long-term.
Make sure to do your own planning and research... Profits are on the way.
Thank you...
➖ You are appreciated.
➖ Your support is appreciated.
➖ Your time is appreciated.
➖ Your energy is appreciated.
➖ Your attention is appreciated.
Thank you for reading.
Namaste.

BOBO The Best Meme Play Available? LONG SentimentHello guys,
Here's my latest analysis for BOBO/USDT on the 4-hour chart. The midterm outlook is ultra bullish. We are currently in an Elliott Wave structure, with clear targets for Wave 3 and Wave 5.
Wave 3 Target: A potential gain of approximately 200% from the current price level.
Wave 5 Target: A potential gain of approximately 400% from the current price level.
We have just reached the key buying zone, making it an optimal time to enter the market. The Fibonacci levels and wave structure support this bullish perspective. Keep an eye on the upcoming moves, as BOBO is poised to reach new heights.
Happy trading!
BOBO To the MOOOUUN :)

VET BTC Long 7X potentials Hi everyone
this is not a financial, investment, trading, or other types of advice or recommendations
this is my idea
and its my art and way of seeing market today
trade with your plan

Vechain to start outperforming Bitcoin !Hello guys, now for real after all this bearish action I get more and more confident that Vechain has bottomed against the USD as well as against BTC.
Bullish divergence, Vechain holding super strong and forming ending diagonal reversal pattern against BTC.
Ready to 10X BTC - VET VECHAIN

VET / BTCVeChain forming cup and handle, positioning itself at 98 as a good purchase price and 133 as a sale price.

✳️ Vechain Longterm Double Bottom vs 810% B.Wave (10X Potential)You know what happens if people can't withdraw to fiat?
What happens if it becomes harder to withdraw?
This is a great setup, the Vechain v Bitcoin (VETBTC) chart... Let's do this!
A bottom/low was hit December 2020 followed immediately a 800% bullish wave.
It all started after the September 2019 low, with the All-Time High for this pair being 5,000 satoshis, the maximum growth peaking at 14,755% on this exchange... Ok these are crazy numbers, let's focus on present day.
We have a 2 years and 6 months long double bottom, June 2023 vs December 2022.
With the double bottom being a higher low when we look back to March 2020 and September 2019.
Long story short: We have 10X potential or more (1,000%+) for this pair in 2024 or early 2025 the latest.
All targets on the chart.
Namaste.

VET/BTC IdeaJust wanted to publish after years of being away. I keep getting requests on what projects I'm interested in lately. My favorite altcoin for reasons of innovation and a great team that has direction. They are veterans in this space, anyway without further ado...


VET finally ready for LONG?!Flip BTC for VET?!
Looks llke the bottom is in for VET.
VET/BTC-chart indicate upwards next! With some push from BTC and a clean break out I definitely see VET on a potential 80% trade.
It will take some time for the trade to play out.
A breakout from the VET/BTC pair could give VET/USDT some momentum to ride on. Both charts looks potential strong in bullish market, if VET break out!
VET/BTC chart and VET/USDT match up well and 80% profit is possible.
P


VETBTC: Bullish Divergence Just Below a Bullish Deep Gartley PCZVETBTC has been trading in this Bullish Deep Gartley PCZ area for many weeks now and is currently Bullishly Diverging just below the 1.618-0.886 PCZ Confluence Zone and if this divergence can bring VET back within the zone then I would be looking for it to trade up to four or five thousand sats.

VET BTC Weekly Bullish run RSI around 30
weak momentum
powerful support
Orderblocks
Enter around 70
S.L Under 60
TP = 120 & 160

VET/BTC longVET with BTC pair show us bullish divergence on rsi on daily time frame. I am long in VET

VET/BTC: Bullish Gartley Falling Wedge Breakout on the WeeklyThere is a weekly Bullish Gartley with Bullish Divergence and a Falling Wedge Breakout on the VETBTC pair.
VET long - earn BTCI think VET from now will start to outperform BTC. VET It's now touching support on BTC pair chart...and I think it could be a great time to switch some BTC to VET to earn BTC :) - Non financial advice.

Crypto , Cryptocurrency Is VetBtc trying to change the downtrend?
Once it breaks the 108 resistance, it can quickly try the 140 level.

VeChain (VET) - parabolic move circa ~2000%On the above 3-day chart price action has corrected 80% since May of 2021. A number of reasons now exist to be bullish.
1) A number of strong buy signals.
2) RSI resistance breakout.
3) Regular bullish divergence with multiple oscillators.
4) The monthly chart (below). Take time to study the channel price action is trading in and the candle printing. Should the following candle print ‘green’, then the rest is history.
Is it possible price action falls further? Sure.
Is it probable? No.
Action? When price action breaks resistance at ‘Go long here’, then ACT. If history is any teacher price action will top out between 60 and 90 days.
Ww
Type: trade
Risk: <=6% of portfolio
Timeframe: 3 - 6 month
Return: 2000%

VETBTC Double BottomLooks like a double bottom on the VETBTC chart, expecting upside movement in the next few weeks.

VETBTC LONG IDEASame thing happened twice before. There is a possibility that it will happen a third time. made an upward attack on every trend break. It is educational work. It does not contain any investment advice. just my own thoughts.

VET / BTC 1Day IntervalAs you can see, VET in comparison to BTC is moving above the support zone, which has already defended the price against further declines.
We are currently moving in a local sideways trend channel, which can be used for short-term plays.
If the price starts to rise, it has a strong resistance zone from 181 to 237 satoshi on its way.

VET/BTC Expanding Triangle Clamping the price before the impulseLocal trend. Time frame 1 day. Expanding triangle.
Coinmarketcap: VeChain
Price squeeze during “market doubt”.
A zone of price squeezing in a narrow range at the moment of uncertainty (doubt) of the market in general.
Clamped by large orders in the required buy/sell range on liquid exchanges. The range is spammed with orders, basically a bot is triggered to make the trades visible and to “protect” the large orders (so as not to “grizzly”, but if they gnaw—"go down steam"). Small exchanges themselves will “pull up” in price over time.
It works the same way (first of all) in pairs also to dollar, but the step is bigger (it is more difficult to hold a range). In pairs to bitcoin, it's easier to do due to smaller % of step (crypto price). The lower the price in satoshi, the more effective step clamping (range holding) is done.
Unfortunately, here on the site it is impossible to show the order stack, it would be more obvious, the chart is a consequence, not the root cause.
The meaning of the action—before a strong impulse up/down price movement, does not matter. You, unlike hamsters (those who are constantly losing money) cannot know exactly in which direction the market will locally go. The impulse (exit) is made under the general market trend (direction of movement). There are exceptions, but it is more about low liquid altcoins during the so-called “market window” (it is now). It helps a lot to move the price impulsively at such moments (decoupling):
1) stops (“market fuel”)
2) scalpers of course
3) oppositely tuned (in most cases, but not always) crowd (the main market participants) at the moment, that is the cloned behavior of people.
This is what the expanding triangle area looks like on a line chart.
This is what this "price squeeze" looks like locally.
On a linear to understand the without the "market noise".
The graph is a consequence of the sense of action in the glass.
