VETBTC | The Long Run!VETBTC Potential is super under-estimated. If long term is not for you, crypto is not for you. I'd buy the dip if i were you. Go LONG and HODL!
VETBTC trade ideas


VET/BTC 95% Profit Now so Book Profit..?#VETBTC Profit Update:-
#VETBTC Now Trading at 87 Satoshi ( 90% Pure Profit).
Mean to say that total 95 % Pure Profit guys.
Our First Entry was 46 Satoshi ( 90% Profit )
And 2nd entry was 52 Satoshi ( 67% Profit )
Both Entry in huge Profit.
Target 1 : ✅
Target 2: ✅
Now Towards our 3rd Target
But Guys sold My 70% Position here at 90% Profit.
Because I am not greedy so 90% Profit within few days not Bad.
so you can also take profit guys partially.
Support :- 82/60 Satoshi
Resistance :- 106/126 Satoshi
Don’t Forget to Click #Like Button and Appreciate me.
Must Follow me for Latest real Time crypto updates.
Thank you.


$VET, 40%+ up in a week w/ volume still increasing... (FOMO?)$VET
40%+ up in a week w/ volume still increasing... (another FOMO case?)
As it looks right now, retest of crossed levels / R/S Flips are for longs.. (~67sats)
As targets ~80/90/100 sats
#VET

VET/BTC looking bullish for long-termVeChain is a popular project with strong team and optimistic fundamental connected to China. Also the chart looks really bullish on High Time Frames. We can see a massive breakout out of 1 year bullish falling wedge with continually rising volume. On 1D we see confirmed BK231 Daily . MACD + Histogram are bullish . RSI on HTF still in neutral zone , ready for bigger move. WatchOUT in next days.

VET/BTC (Strong Weekly Candle about to Close)VET/BTC
-the weekly candle is about to close in a few hours
-the strong trendline is now broken
-weekly local resistance at the 60s is broken
-potential double bottom reversal is about to confirm
-upside target of this break is up to 100s
-stoploss is placed under 52s


VET Moon mission confirmed!Hopped in this bad boy at 51 sats and i'm not fucking selling till I see 100 sats on my chart....

VeChain (VET) Breaks Above MA200, Next 80%+ MappedVeChain (VETBTC) just broke above MA200 while aiming higher.
This is a strong resistance level marked on this chart by a black line.
We consider VETBTC strongly bullish above MA200 and EMA50 (0.00000053).
We can switch to bearish if prices close below the last low at 35 satoshis (0.00000035).
This is a solid altcoin pair and is looking to grow some more... Additional details on the chart.
This is Alan Masters.
Namaste.
----
Apr 11 | VeChain Trade Crypto Signal (VETBTC | 311%) AlanMasters

VET/BTC 9-week Double Bottom ReversalVeChain just closed above the previous recent high, confirming a 9-week double bottom as a possible long-term trend reversal. We could see VET reaching and testing the next strong resistance in a few months.

VECHAIN Bullish Break Daily chart:
Vechain break out of resistance at 61 satoshi. A close above the top bollinger band at 61 satoshi is a good sign and will also be a good pivot moving forward. As long as we are closing outside the top bollinger band its bullish. The moment we close inside and below the top bollinger band that will be a warning sign for a pullback.
RSI is getting into the overbought territory so a pullback here would make sense but ONLY IF A LOCAL TOP IS PRINTED. So far there its not there yet. Daily closing aboe 64 satoshi which also happens to be the 200SMA will be really good.
Monthly Chart:
A close above the 21EMA at 57 satoshi will be the first time in 3 months after we lost it back in Feb 2020. An open and close above 21EMA on a weekly basis will be bullish.
RSI is out of the bear zone and now in an upward trajectory at neutral zone ( 52 ) read. Any price action below the neutral zone ( 50 ) will be a warning sign for bears getting control back.
Stochastic is also bullish crossed but its needs to get out of the bear zone ( 45 ) and above.
Over-all VECHAIN is showing recovery with PIVOTS between 57 - 61 satoshi. Any close below there on a daily or weekly is a bad sign.


VET / BTC Potential double bottom. Past idea over + 200%VeChain (VET) potential double bottom.
First target + 40%
A breakthrough of resistance and the continuation of the uptrend, the second target is + 80%.
Further goals depending on the strength of the trend.
Stop Loss
Under key support levels during your entry into the market.
The previous trading idea profit at target levels from +60 to +210%.
VET downward wedge. First target + 60%
Entrance zone at the lowest price.
www.tradingview.com
Trend development. The first sales area + 120-140%
The second target was achieved +200%
Develop your brain. Do not be theorists, but practitioners. A theory without practice is zero.
Only the "weight" of your deposit matters. Everything else is "water"

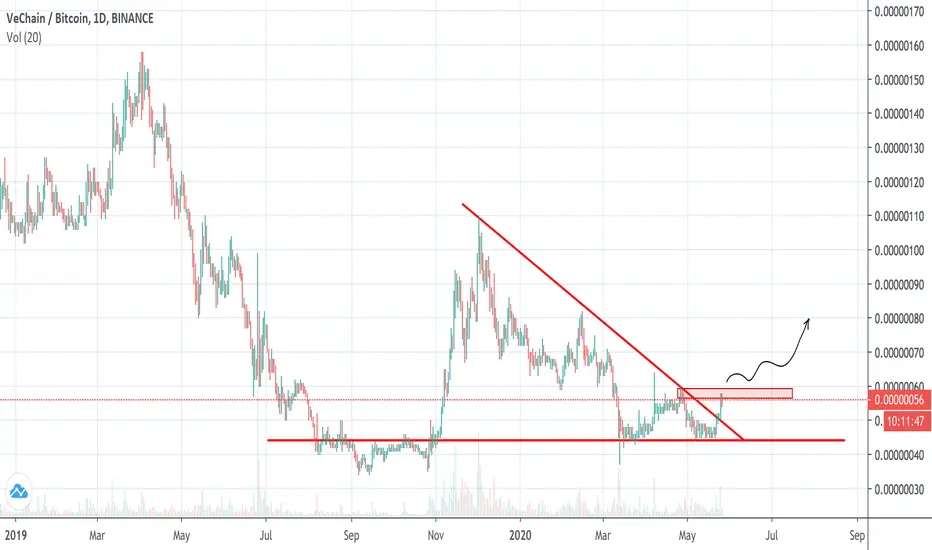
Vechain / BTC Breaks Out! Will it go to ATH?VETBTC has successfully broken out of the long term resistance trend line on the daily charts. On the weekly charts the closing is awaited for confirmation of the same by post closing on 31st May 2020.
In the meantime, our initial position has already yielded around 30% returns and more returns are possible in the coming days if the chart structure remains intact.
Below is our earlier Long Call on VETBTC Pair
Earlier Analysis 4H Chart:
1D Chart:
The daily chart here shows the initial breakout region being tracked by a highlighted red eclipse.
The red line is the long term resistance line VETBTC has broken out of. The thick green line should act as the immediate support for VETBTC to continue moving in an upward trend. The green line at 35 sats is the long term support expected to be held but for current position to continue the SL would be maintained at the thick green line. Any break below the same could lead to testing the long term support at 35-37 sats region and hence shown with red downward pointing arrows.
The green highlighted polyline is the region for VETBTC to grow going forward with ghostlines drawn for only reference. The actual movement will be monitored over a period of time.
Any break above the yellow line could lead to a potential parabolic rally for VETBTC. Be cautious while trading in that zone.
Our targets on VETBTC pair stand at 64 / 82 / 110 / 150 / 250 sats. We are active in VETBTC since 45 sats level.

$VETBTC 2 year bearish trend reversalBINANCE:VETBTC
#VeChain is looking fantastic. Everything points to a long term trend reversal and the start of a bullrun on the weekly.
1. The MACD is crossing over bullishly on the weekly
2. Price is currently above the ~2 year long diagonal upper resistance line. (wait for close for confirmation)
3. On the daily the Ichimoku indicator looks like it is about to pierce the cloud, with a Kijun + Tenkan flip to follow. Lagging span has just bullishly crossed the price to the upside.
4. Double bottom has formed and I expect a big move if the neckline is pierced
I would wait for a confirmation of the Ichimoku cloud turning to support from resistance, as well as a break of the double bottom neckline.
Time to pay attention.

VET / BTC, READY FOR BALLISTIC BREAKOUT! (Very Short Edit) VECHAIN IS READY! Al ready trading between 100 and 200 EMA on daily! And on the edge of the downtrend we have followd years!
Keep an eye on Vechain! Looks realy good! :)

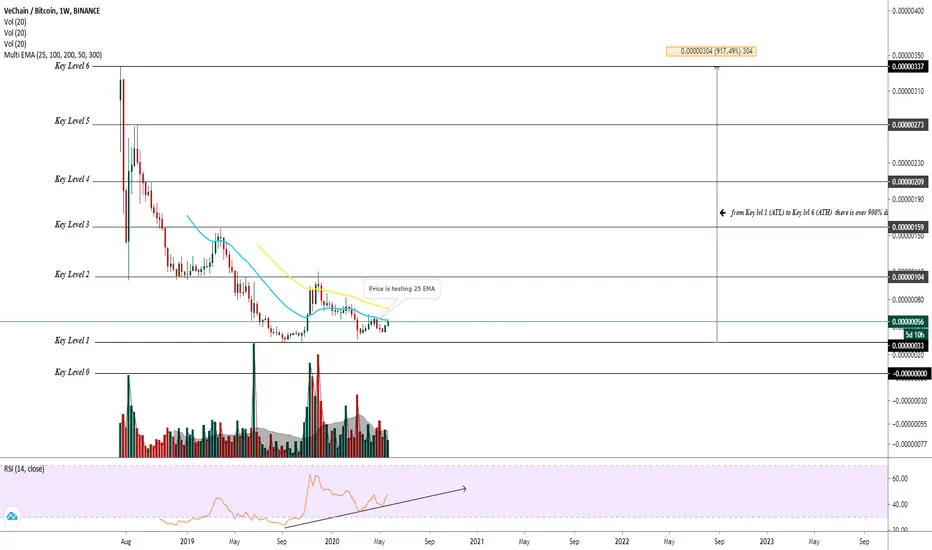
VeChain's key levels of support and ressistanceHello, and thanks for reading into my analysis,
I'm not a fan of writing but I will try to explain this as simple as possible.
Every price chart has areas where the price is either being pushed to the upside or pushed to the downside. In this chart, I marked the areas of price confluence in 6 key levels + level 0.
This means I marked potential areas of support and resistance.
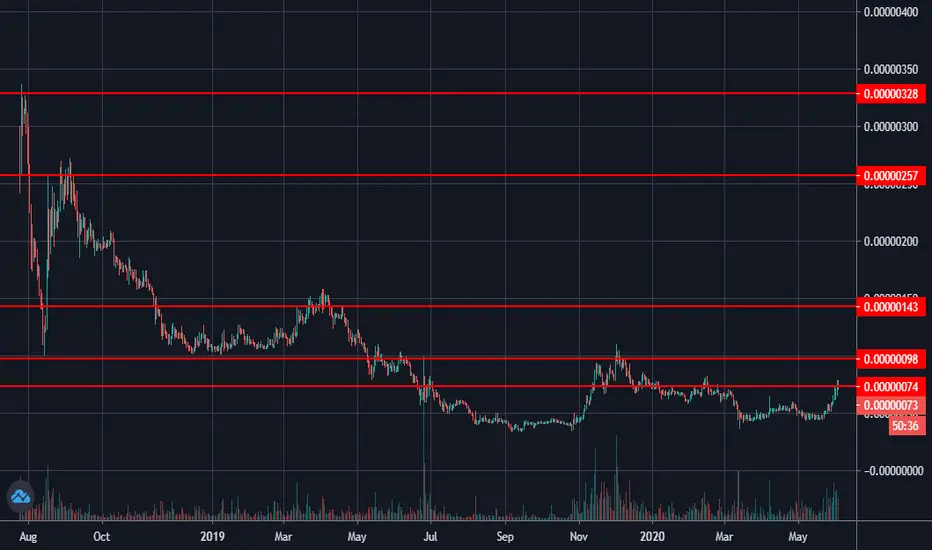
Key LVL 6 = First resistance showed up at 337 Sats.
Key LVL 5 = Acted as resistance as well and has been sitting at 273 sats.
Key LVL 4 = was a sign of weakness which touched the 209 sats mark before we got a hell of a drop.
Key LVL 3 = acted the first time as support in the history of levels and led to a pump all the way to LVL 5 before dropping again to key LVL 2 which was one of the most hurtful drops in this downward-direction trend.
Key LVL 2 = was holding nicely as support until we tested KEY LVL 3 again and failed at 104 sats (that was the most hurtful drop (-80%)
Key LVL 1 = Sitting at 30 sats, is acting as the strongest key level so far but we got rejected once we tried to break key level 2. From here on things get very interesting, it seems like we are consolidating in this key level area to eventually break to the upside.
Key LVL 0 = Has never been touched so far and is the last key level. (let's hope it stays that way)
EMA:
The EMA's I use are the 25&50 EMA.
50 EMA (yellow) has been acting as resistance for now.
25 EMA (green) has been acting as resistance as well but got flipped into support as we tested key level 2 and now is looking to flip into potential support.
RSI (14): Is creating Higher highs right now, the market seems to be interested in buying.
Volume: The volume MA is growing as time passes by which is a great sign overall
Fun fact: From all-time low to all-time high we have 917% to gain
Greets,
Doctor Pleb

Possible outbreak on VETSignaled in our telegram channel May 21st - the coming hours are crucial to see if VET will be another token to have a strong run
VET started it's Mission! $1 to $1.20 this YearIf you follow my trades, i don't talk crap, and this is a STRONG BUY SIGNAL!
Follow the "White Rabbit" and just buy one of 2020 best investments.
THIS IS NOT A FINANCIAL ADVICE, PLEASE INVEST AT YOUR OWN RISK.
