VETBTC trade ideas

Vechain about to climb up a bit (VET)Seem like we are about to explode (again) on 4h chart. Hope it plays off

VET Looks BullishVET / BTC
Exchange : #BINANCE
Buy : 93
Targets :
Tp 1 : 100 (7.5%)
Tp 2 : 108 (16%)
Tp 3 : 117 (26%)
Stop loss zone : 87 ~ 86

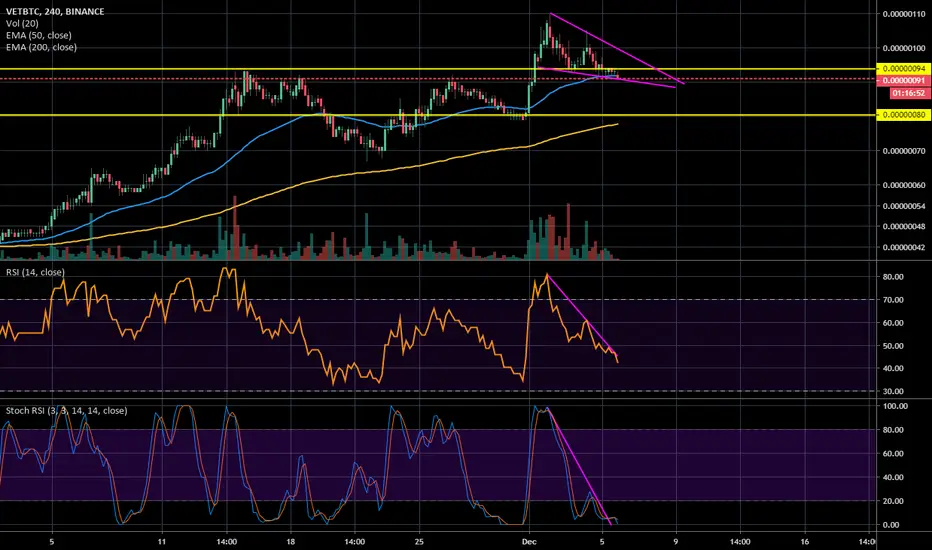
VET / BTC 2 HOURSo This Time we take an 2 hour chart. This is starting to look simular:
* The price acion, We see this correcion channels before. it's look to consilidate to a new bullish outbreak.
* The main price trendline is still in tackt.
* On the RSI we see 2 times before a round bottom. It's also a sign that there's some gearing up the moment to a breakout. Also each round bottom is an higher high on the RSI.
* Look to the volume candles in the bigger time frame, it's getting higher en greener! We like green rihno bars, don't we?
* Short term volume is dropping fast, it's looks bullish to me!
Have a great day!

BTC / VET WEEKLY ANALYZES Vechain weekly basic analyzes,
Candle 1 strong bullish weekly momentum bar! Very Powerfull bullish outbreak
Candle 2 Bearish consolidation bar under the 50 EMA. It means gearing up some new bullish momentum.
Candle 3 Finaly Bullish Engulfing bar en also full break the 50 EMA.
Canlde 4 looks it wants to close like an bearish spinning top dildo. But it could possible be an needed retest on the 50 EMA to go futher with this bullish momentum. Soo let's what wil happen the last days for final weekly close.
Have a good day!


VETBTC Sell OpportunityThe chart of VETTIC is completely bullish but RSI is over Bought, retracement should be happen.
The price of a coin moves like waves so it doesn't matter if the price in bullish or bearish trend , there always will be correction wave.
The price hit very strong resistance then pulled back but this trade will be invalid if the price breaks out the resistance line at 0.00000106.
Please Do Not Forgot To Hit The Like And Follow Button To Get MORE.

VET/BTC CryptoEngineering Testing ALGO signals 125% profitI'm testing this Algo co-pilot system thats not available to the general pubic as of yet..working great so far! If you would like to test it out, let me know and all get you in touch with the creator!

VET / BTC 4 HOURMy Man Vechain,
Looks like he build up some new bullish momentum.
* Looks like building an falling wedge on the 4 hour
* Volume is slowly dropping
* Stoch will try gearing up the momentum
* Nice suport on the 50 EMA
* No worries on the daily on the golden cross mates, still in play :)
Have a good day / night :)

VET / BTC WeeklyMR VET Let's talk about the weekly,
We see weekly (1)bar as a beautiful bullish engulfing and breaks for the first time the 50 EMA. This weekly bar (2) looks a little bit nasty. Looks like a spinning top dildo if we close it like this. But if we hold the 50 EMA i m leaning to the bullish case. Stoch clearly wants to shift momentum. But the question is, will that happen? Also RSI is moderate high in daily.
We will follow this!

VET / BTC DAILYVechain my man, what's youre plan?
Vechain looks still Bullish
* Golden cross confirmd
* Daily candle looks like the next consilidation candle to me.
* Volume starts to slow down
* Needs to break the Yellow line on the RSI triangle
* Stoch healthy up
* Last, on the 2 hour looks it like to make an new triangle.
Have a good day!


VETBTC trendreversal confirmedWelcome fellow Tradingviewers,
This analyses is only showing you guys my vision on VET and should not be considered as financial advice. If you agree or find this analyses useful, don't forget to leave a Like !
We can clearly see that VETBTC has broken out of the falling wedge it has been trading in for the last year or so.
Monthly :
We have seen a huge bullish engulfing candle, with a lot of Buying volume last month which indicates a lot more room for the upside.
Weekly :
We have closed the last weekly candle in a huge bullish engulfing one, indicating more upside.
We have also closed beautifly above the 50MA for the first time since this chart is live.
Volume is increasing and seems to be confirming our positions.
RSI and MACD are still nowhere near bearish territory.
Daily :
VETBTC is now fighting the first taking profit zone at 100 sats after seeing some sellof at 93 sats, we are now ready to try to test 100 after the beautiful bullish engulfing candle 2 days ago.
The volume has been starting to increase on the way up, which usually is a very bullish sign coming out of a wedge like this.
We are also above all moving averages on the daily graph which gives us even more confidence that the prices are going to keep on rising.
RSI , MACD are also bullish on this breakout and ready for another leg up.
What's next?
We have set three targets from the falling wedge, they can be found at 100, 160 and 220 sats.
Depending on how fast and well these targets are going to get reached will change our trading plan, but as we know falling wedges usually indicate a trendreversal and it is not uncommon that they easily override their targets!
If you have any questions please let me know in the comments below!
Kind regards,
Forallcrypto

VETBTCVETBTC update
Entonnoir : W/D/H4 (swing)
Comme je l'avais dit dans ma dernière AT, la tendance daily était extrêment vieille et on a donc eu droit sans grand étonnement à un beau dump à ~65.
Pour le moment, le biais est toujours haussier en weekly. La tendance daily en est à sa 2ème impulsion et donc théoriquement safe à trader. Cependant, le fait que nous soyons juste en-dessous de la grosse zone de S/R des ~110 ne me ferait pas prendre position.
Je préconise d'attendre d'avoir passé cette zone de S/R avant de prendre position à l'achat sur cette paire.
A noter que si l'on casse les ~95 à la baisse, ce sera mauvais signe pour la suite puisqu'on réintègrera le dernier sommet weekly (découpage rose) et l'ancienne compression daily (jaune), ce qui pourrait nous entrainer jusqu'à la zone de S/R des ~85 voire même jusqu'à la borne inférieure de la compression daily à ~70.
—————
Funnel : W/D/H4 (swing)
As per mentioned in my previous TA, the daily uptrend was already very old. Therefore, I was not very surprised by this dump to ~65.
The bias is still bullish on weekly. The daily uptrend is at its 2nd impulsion wave and still safe to trade in theory. However, the fact that we are just under the strong zone of S/R at ~110 would not make me want to go long at the moment.
I would rather wait the price to break this zone of S/R before going long on this pair at all.
Also note that if we break the ~95 level down, this would be pretty bearish for what's next as it would mean a reintegration of the last weekly top (pink drawing) but also of the previous daily compression (yellow). This could lead the price back to the zone of S/R at ~85 or even to the lower part of the daily compression at ~70.

You Might Get Vetrolled Again!Expanded flat correction could be taking place here 3-3-5 structure we have an invalidation level marked to flip bullish.

VET / BTC DailyMR Vechain,
I see no major reversal for now, i m still bullish .
* If these daily red bar close on the price we have now it looks to me like an consolidation bar to rebuild the bullish momentum.
* I think it's import to watch RSI to the yellow line. If bounche on the yellow RSI line i think the rihno's are still in control.
* Daily stoch still healthy up.
* Only beaish signal is the bearish devergence, but it could already played out.
To morrow new Vechain update!

VET countinue its run - see chart for targetsVet is turning green again after rumours again. See my buysignal at 37 sats - if you hold from here you had over 200% profits.. Once support is broken - it might turn to support. If support is broken - it goes down to the next once. Nice way to short.

VET/BTC taking a breatherVET/BTC is taking a breather. It could find support @ 90sats. If it falls 25 % like it did the last time in this run, it should get supported at 83 sats. If it goes lower then 83 it would fall out of our rising pattern. Further there will be suppport at 72 and 64 sats wich is at the 0,618 FIB.
longterm its still very bullish!

VET / BTC Daily So Mr Vechain,
You look healthy to me! We finaly make the golden cross! It's good possible we see some fireworks the next days!
* Stotch healthy up
* Golden cross completed
* Rsi possible making some triangle
* Last days some nice healthy big green rhino bars :)

VETBTCPossible C&H
between .5 and .618 would be a great buy zone
watch for divergences
Just A thought

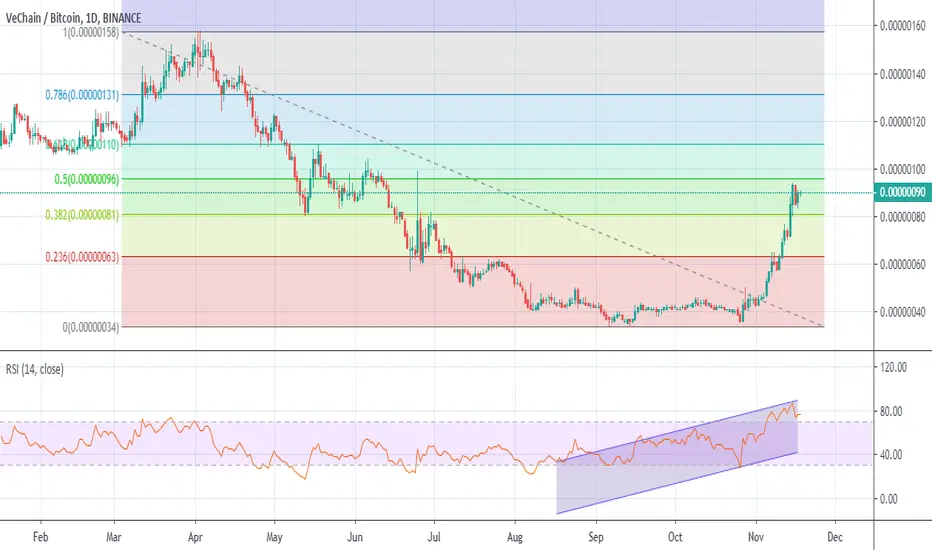
$VET showing strong Fibonacci$VET became one of my favorites after I saw it created a strong support at 35- 40 sat area. So I brought in bag full of $VET during it lower consolidation area.
My recent analysis using Fibanacci reflects that we might see a strong uptrend in $VET if $BTC keeps stable.
You can enter between 85 - 90 area. Stop loss at 75 or when $BTC goes crazy
I will set exits as below, overall 50% profit from entire plan. Risk/Reward Ratio 1:3
30% of volume at 110 with 22% profit
30% of volume at 130 with 44% profit
30% of volume at 150 with 66% profit
10% of volume at 180 with 100% profit
VET/BTC VECHAIN *TA & fundamentals are the power*every time VET comes back down a little bit to take a breather, its getting suported by the EMA21 and by our support line.
The price is still 70 % down from all time high.
Vechain will be huge and it will climb up to the Top 10 coins !
They have endless partner ships with the biggest companies in china.
Big news from Vechain & Microsoft were pushing the price today!
