VeChain Twist: Next Crypto Crash or Rally?VeChain is moving in the direction we anticipated, heading downwards. Of course, we'd be pleased with a continued parabolic rise since we have two open entries that have performed exceptionally well, with our stop-loss significantly moved up.
Thus, we've already taken profits, securing a good position, but we aim to build a larger position in the overarching Wave (2), where we expect it to reach between 50% and 61.8%. This is significantly distant from the current price.
We also anticipate that VeChain might react more sharply to a potential sell-off in the cryptocurrency market than other assets, given its recent parabolic rise and increased volatility. As clarified in our last analysis, we've reached the Wave ((b)) at the 138% level, between 127.2% and 138%, and haven't seen this level since, leading us to expect further price declines. We estimate that for Wave ((c)), we might not immediately see a conclusion but rather a drop to the level of Wave 3, followed by an overarching Wave B and then a Wave C formation. The exact unfolding of this overarching corrective Wave (2) remains to be seen. However, we will not alter our stop-loss and will wait to see if VeChain falls as much as we believe it might.
VETUSD trade ideas

💰 #VET/USDT VET produced the channel on weekly timeframe👀 Se💰 #VET/USDT
VET produced the channel on weekly timeframe👀
Send it if we do break out✈️

The expected movement of the $VET priceBased on historical chart analysis ..
The price may break the price channel shown in yellow and rise by 100% to 120% .
then retest the channel again and then move towards a new historical peak.

VeChain (VETUSD): Last Impulse before a bigger correction? 📈🤔Let's take a closer look at VeChain BINANCE:VETUSD on the 1-hour chart. We're continuing to hold Wave 4 well at $0.025. Since then, we've developed a 5-wave structure leading to our overarching Wave ((i)). Now, we're anticipating the formation of Wave ((ii)), which should fall within the 50 to 78.6% range. Dropping further down would significantly decrease the likelihood of this still being a Wave ((ii)).
Following this, we expect an uptick for Wave 3 to at least $0.035, representing an increase of nearly 30 percent. This is the minimum we're projecting for our Wave ((iii)).


what next for $VET in Short Term ?The Truth Is We Are In A BullMarket And Taking Short Has More Risk Than Long Positions. If WE Oppose A Correction In This Area; It Would Be A Golden Opportunity To Buy Specially Altcoins That Haven't Rise In Their ETH And BTC Pairs. NYSE:VET Is One Of Them. The Momentum Is Bullish And Most Altcoins Have This Pattern As BTC Had but Broke That And Went To 72K And Now We Can Say 75K Is Inevitable. If There Is A Chance To Buy Altcoins In Opposed Correction; This Head And Shoulders By Breaking 4H TimeFrame 200 EMA Bull Support Band Resistance To Daily EMA Bull Support Band Resistance ( 0.03230 Area )As You Can See In The Chart Below. Of Course, It Should Break My Green Trend Line For Stamp Approval Of This Target. Otherwise, Its Next Target In The Bullish Scenario Is 0.07525. #DYOR #NFA

VETUSD - Bullish CurveVETUSD is in the process of breaking out along this curved trend line support
I expect it to hit the upper dotted line and possibly even break it
Bullish.
This is the 4Hr chart for VETUSD.

$VET Vechain coming to test COINBASE:VETUSD coming down to retest prior resistance.
lets see if we get bounce

Trading Analysis for VeChain ($VETUSD)Let's dive into an analysis of VeChain ( BINANCE:VETUSD ) from a wholesale and retail perspective, emphasizing the importance of buying at value and selling at a premium.
Overview:
VeChain is currently trading within a specific price range, indicating potential buying and selling opportunities for traders. Our analysis focuses on identifying these opportunities and understanding the broader market context.
Wholesale Level:
At the wholesale level, VeChain is trading between $0.02945 and $0.03705. This range suggests the price at which large-scale traders or institutions are acquiring VeChain. Buying at the wholesale level ensures favorable prices, akin to purchasing goods directly from manufacturers at a discounted rate.
Retail Level:
Conversely, at the retail level, VeChain is priced between $0.26 and $0.14. This range represents the price at which individual traders or investors typically enter or exit positions. Buying at retail prices may not be as advantageous, analogous to purchasing goods from a retail store at a higher markup.
Higher Time Frame Analysis:
On a higher time frame, VeChain exhibits a broader trend with significant price levels. Currently, the trend is upward, with a value zone identified between $0.029211 and $0.0400. This zone indicates favorable buying opportunities, as prices are within or below the perceived value range.
Stochastic Indicator:
The Stochastic oscillator is a momentum indicator that helps assess overbought or oversold conditions. Currently, the Stochastic indicator for VeChain is undervalued, with the K% at 20.95. This reading suggests that VeChain may be oversold, indicating limited downside potential in the near term.
Imagine VeChain as a product available for purchase. Just like buying goods, it's ideal to buy VeChain when it's priced lower, similar to purchasing items at wholesale prices. Buying within or below the value zone ensures you're getting the best deal possible.
Conversely, selling VeChain when prices are higher, akin to retail prices, allows traders to capitalize on premium rates. This approach mirrors the concept of buying low and selling high in traditional markets.
Considering the Stochastic indicator, which currently indicates oversold conditions, VeChain may be poised for a potential price rebound or stabilization.
In conclusion, analyzing VeChain from both wholesale and retail perspectives provides valuable insights for traders. Buying at wholesale or within the value zone offers favorable entry points, while selling at retail prices allows for potential profit-taking.
Let me know what you think about the project in the comments!
Remember, successful trading involves strategic decision-making based on market analysis and risk management. By adhering to the principles of buying low and selling high, traders can enhance their chances of profitability in the volatile cryptocurrency market.

VETUSD: Vechain trade to complete fifth Elliott waveVechain has printed a nice rally in its chart that so far has yielded a third wave, currently correcting in wave four.
This market may expect to continue its rise in wave five, as depicted.

$VET BULL PENNANT- $0.07 INBOUNDVechain is forming a nice bull pennant on the daily, once this breaks, we should see a run towards the 7c mark.

VETUSD short term targetsHere is my short term EW count for BITFINEX:VETUSD
Both the weekly RSI and Stochastic are showing signs of real strength.
My initial target for the wave of this impulse is around .0676 (1.618 fib extension)
We may see an ABC correction from there before breaking this resistance and moving higher.
I'll post updates as this wave nears completion to show what my thoughts are next for this chart.
Overall, BITFINEX:VETUSD is showing a lot of strength and we could see much higher prices in 2024.

$VETUSD emerging from a wedge VET is emerging out of a wedge. Looking bullish. Higher lows and rising above 8 EMA high .LONG!

Vechain looking for a bullish pumpVET is one of the few cryptos that has not gotten a significant bullish rise over the past several months. It is currently testing a historical parallel trend line that was previous support over the past few years.
We could be seeing a 4-5 cent vechain if it find support here.

VeChain 1H VeChain 1h shows a trading scenario where the price is interacting with significant levels identified by Smart Money Concepts, specifically with a bearish fair value gap (FVG) indicated by the red zone. The bearish FVG is a region where the price previously dropped sharply, suggesting a lack of fair value as perceived by the market, and it typically acts as a resistance area when approached from below.
Currently, the price is consolidating around the 0.382 Fibonacci retracement level at approximately $0.0462, with the FVG looming above as potential resistance near the $0.0480 level. The RSI is hovering around the neutral 50 mark, indicating a balance between buying and selling pressures. The MACD is below the zero line, signaling bearish momentum, but the converging lines could imply a weakening of this momentum or potential reversal if they cross upwards.
Traders using Smart Money Concepts might anticipate that if the price reaches into the bearish FVG and rejects, it could confirm the presence of strong sellers in that area, potentially leading to another leg down. Conversely, if the price were to breach the FVG, it could indicate a shift in market sentiment and a possible change in the dominant trend.
Watching how the price reacts to these Smart Money indicators, alongside other technical elements like Fibonacci levels, RSI, and MACD, can provide insights into near-term directional biases and potential breakout or breakdown points.

VeChain weekly analysis📈👀VeChain weekly analysis📈👀
From its ATH VET perfectly touched the POC🟢corresponding to the FIB Golden Pocket🟠
The DPPM just switched🟢‼️
Will MA Ribbon follow❓
bearish scenario🐻
Price goes direction FIB 78.6% - the last support
bullish scenario🐂🚀
TP1 = FIB 38.2%
TP2 = last ATH
TP3 = FIB 127.2%
TP4 = FIB 161.8%
You don't believe in these high marcet caps❓
Look at Bitcoin‼️
Comments💭, Likes♥️ & Follow🔗 appreciated🤗
Disclaimer:
Not financial advice
Do your own research before investing
The content shared is for educational purposes only and is my personal opinion

VETUSD; Vechain Elliott Wave HistoryThe Vechain project has maintained an active trading market for its token (VET) for several years. With the ups and downs of the larger blockchain sector it has printed the large pattern of an Elliott Wave flat correction on the chart.
Emerging from this correction appears a fresh impulse driven by the 2024 bitcoin run.

Vechain- Correction soon startsGoing Short for the Ve-chain
-Overbought RSI
-Very high volume indicating the climax of the uptrend
-wave (V) has completed

Can VET Climb the Wyckoff Ladder? Decoding the ChartThe VET/USD chart shows an interesting development with a potential resemblance to a Wyckoff schematic. Based on technical analysis, this pattern could indicate a move towards $0.25 in a few months. However, remember that the crypto market is volatile and reaching this target is not guaranteed. This is not financial advice, and other factors are crucial before investing. What are your thoughts on this potential pattern and its implications for VET?

VETUSD On the verge of an enormous rally.VeChain (VETUSD) is making this week (1W) a triple bullish break-out as it broke above December's Resistance, the Bear Cycle's Lower Highs trend-line that started on the April 2021 All Time High (ATH) and the 1W MA100 (orange trend-line), which is the first time above it ever. A closing above the latter, confirms the beginning of a new long-term Bullish Phase for VET.
This resembles the break-out on the June 08 2020 1W candle, which extended above the 0.786 Fibonacci level measuring from the first Lower High and after a pull-back to the 1W MA50 (blue trend-line), it made the ATH just below the 2.0 Fibonacci extension.
As a result, our target on a 6-month horizon is 0.14500, which is at the bottom of the Lower High Resistance Zone.
-------------------------------------------------------------------------------
** Please LIKE 👍, FOLLOW ✅, SHARE 🙌 and COMMENT ✍ if you enjoy this idea! Also share your ideas and charts in the comments section below! This is best way to keep it relevant, support us, keep the content here free and allow the idea to reach as many people as possible. **
-------------------------------------------------------------------------------
💸💸💸💸💸💸
👇 👇 👇 👇 👇 👇

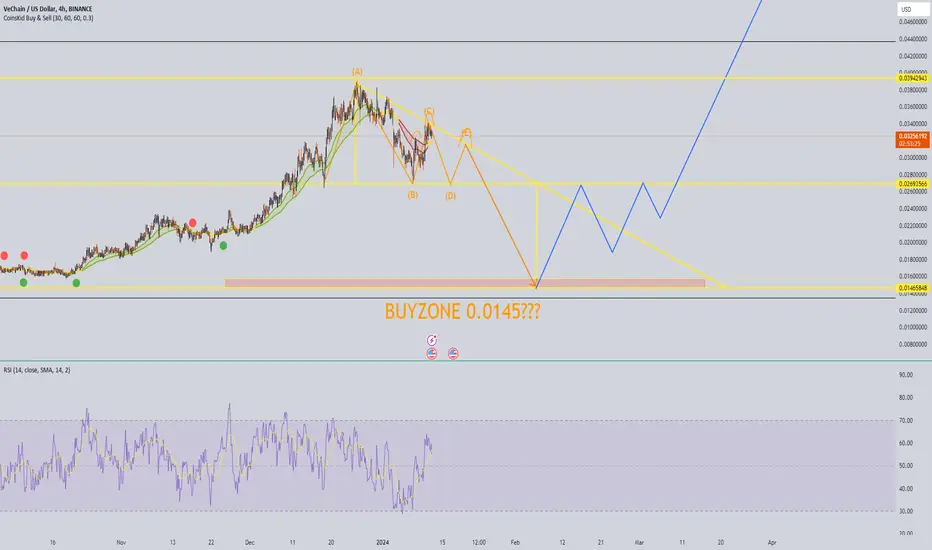
VET BUYZONE visible?? Looks like we are going to have some bearish senario before extreme bullishness. If the 0.026 we can see a beautifull move to the 0.0145 level. From there we need to see some compression pattern, put stoploss below and go to Niburu!!
Lets see how it works out mamacotas!!!
vetusdtT=0.057
T2=0.071
In technical analysis, Wolfe Waves are price patterns consisting of five waves that indicate either bullish or bearish trends.
To be properly identified as a Wolfe Wave a series of criteria must be met, such as wave cycles each being similar and distinct price action in the third and fourth waves.
For a true Wolfe Wave, the fifth wave instance in the pattern will be followed by a breakout in price.

🚀 VeChain Analysis: Navigating the Waves 📈VeChain (VET-USD) is showing promise on the 4-hour chart. We are currently in an upward 5-wave structure, specifically in Wave 4. Waves 1 and 2 were completed on September 11, 2023. Following a strong surge for Wave 3, we've observed a recent pullback since the end of last year for Wave 4. I anticipate this wave to find support between 38.2% and 50%. Subsequently, Wave 5 could propel us to possibly reach $0.055 USD. I'll keep you updated as the situation evolves. The Bitcoin spot ETF decision in three days will likely be crucial. 🔍🚀
