Vechain(VET) Update: Buy Signal 13 EMA Crossing Up above 50 SMA Vechain(VET) Update 07/05/21: 40% Gain from current price level to 127.20 Fibonacci extension @ $0.33. See previous analysis below
Vechain(VET) Update 27/04/21: 228% Gained from our Buy Zone 4 from the 4th April to 16th April...Next Stop $0.33 from Buy Zone 5 which is an 81% Gain from 50.0% Fibonacci retracement level. Lets take advantage of the current prices as we will not be seeing these low prices for a long period of time once the Bulls are back in the market for the next push phase. Use the Buy Zones to map your Buys or simply for dollar cost averaging. The Fundamentals are great for this project and we are very bullish on Vechain and can see EOY price target between $2 to $5. See previous analysis below. Happy Trading :)
Vechain(VET) Update 05 /04/21: VET perfect bounce from Buy Zone 4 37% Gain to $0.11. See previous analysis below.
Update 30/03/21
Vechain(VET) looks ready for another 37% Gain to $0.11. Since the 27th March Vechain has been consolidating between $0.087 & $0.097 range. Stochastics are now showing an oversold market and VET looks ready for continued Bullish momentum to the upside. Be patient with your entry as we expect VET to test the 78.60% Fibonacci level before confirmation of a move towards our target at the 127.20% Fibonacci level @ $0.11. Failure to test the 78.60% Fibonacci would see a 12% Gain from the current level to the previos ATH tested on the 22nd March @ $0.10.
Use the Buy Zone ($0.088) to map your entry if you are not already riding the current wave, from here you can DCA to accumulate more coins, 37% Gain to our $0.11 price target.
See previous analysis below. Happy Trading :)
$VET #Hodl
Update 23/03/21
Vechain(VET) looks ready for another 46% Gain to $0.11 at the 127.20% Fibonacci level. Stochastics on 4H showing an oversold market at this price level. On 22 March VET reached $0.10 on the Binance exchange. Since reaching this price level, the price broke below the 13 EMA and 50 SMA as the profit takers came into the market after 21 days of this strong bullish continuation pattern. Although we have broke below both 13 EMA and 50 SMA , overall VET is still bullish and we can expect a bounce from the price pushing above the 50 SMA but be patient as they may be more profit takers in the market. There is a high probability the Bulls will take back control and continue to keep pushing the price higher. Currently VET is showing signs of a weak retracement just below the 78.60 Fibonacci level. Use Buy Zone 3 to map out your Buys from here and if the 13 EMA crosses below the 50 SMA , we will be looking to DCA and Accumulate between the 61.80% to 50% Fibonacci level. From the 61.80% Fibonacci level we expect a 57% Gain to the 127.20% Fibonacci level, this would be the worst case scenario if we get a stronger retracement. See below previous analysis of a new ATH target @ $0.14 as this is the best case scenario from here. Happy Trading :)
Vechain Monthly Outlook Update 23/03/2021
Vechain(VET) Explosive Move New ATH Target, 62% Gain to $0.14, we are very confident this new price target will be reached over the next coming days/week(s). Stochastics showing an oversold market on the 4h
*Update Vechain Outlook 20/03/21*
Vechain is still on course to our 127.20% Fibonacci level, beautiful continuation pattern. Some great Buy Zones to DCA in this channel. New Target @ 161.80 Fibonacci, lets ride this wave to $0.11, 24% Gain from current price level.
Vechain dropped into the perfect Buy Zone zone to enter if you’re not yet in or want to dollar cost average if you’re already riding the current wave. Happy Trading :) See previous analysis below.
*Update Vechain Outlook 18/03/21*
Road to $0.10 is clear, we are still in a strong continuation pattern in search of new ATH at the 127.20% Fibonacci level in the short term. Use Buy Zone 3 to set up your buys, perfect sniper entry would be at the 78.60% Fibs (33% Gain to 127.20 Fibs). Watch for price action as we may see a small retracement down to test the 50 SMA just below the 78.60% Fibs before pushing to the upside towards the $0.08 price level and further $0.10 (40% Gain to 127.20% Fibs).
*13/03/21*
Vechain's price soared to a new ATH on 12/02/21 reaching $0.606 on the Binance exchange. Following the new ATH there was a small retracement before trying to push past the resistance set at ATH , but this failed to break on 19/02/21 and was met with huge selling pressure at these price levels, retracing down further, quite sharply after 4 days on 23/02/21 touching the 50 SMA on the daily chart with a low of $ 0.0341. The downward pressure was met with a sharp bounce on the 50 SMA recovering in a day 24/02/21 back to the 38.20% Fib retracement level showing strong signs of Bulls still in the market. As of the past 3 days the price has been consolidating between a small range between the 38.20% Fibonacci retracement levels and 23.60%. Further to note the price on 2 occasions has tested to break below the 50 SMA failing twice signalling strong bullish pressure and signs of the Bulls to continue driving the current price to test the ATH yet again whilst also setting the sentiment of a possible new ATH at the 127.20% Fibonacci retracement level @ $0.0702.
Furthermore the 200 SMA has been tested at 3 occasions on the 4H Chart, failing to break past this level. Vechain is in a perfect zone for Buys back towards the ATH . Stochastics on the Daily chart signal an extremely oversold market so expect Vet to push back 55% back to ATH levels and Further 74% to 127.20% Fibonacci with the potential to set a new ATH in the coming days to weeks in March.
The Fundamentals are great for this project and we are very bullish and can see EOY price target between $2 to $5. Buy Zone 1 @ 23.60% Fibonacci retracement level for the perfect sniper entry. Be patient, wait for confirmation before entering any buy. Happy Trading :)
VETUSD trade ideas


Vechain Ascending Triangle, wait for breakoutWatch for a break out and back test before entering position.
This is a popular one, it should pump when it confirms the signal.
Good Luck

Bullish or Bearish DivergenceLong either way...
"Hey god of money, please give us more money" - Ronny Cheng
The big move coming, needs to hold the ma.

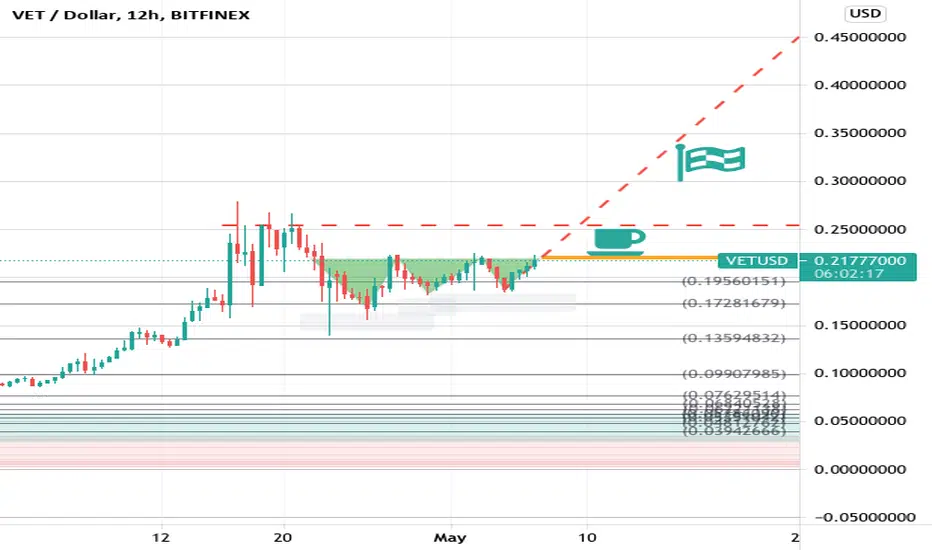
VET BET12 HOUR. Now that we've just about reached the neckline, we can anticipate the handle forming on this cup; touching $0.25, cooling off, and then $0.030. $0.172 is the most important support to hold if we're to continue, don't worry. Speculating Elon Musk's scheduled SNL appearance pumps all of crypto, the event just happens to fall where our handle belongs. I will never short my top holdings, this is one.
Vet price predictionHere is some idea on what possible outlooks we can have, I am looking for daily candle close above 0,21. If Vet can hold it above, it is very likely we will see some positive move to the upside in coming days. What is your thought on that?


VETUSD appears poised for a breakout!VET has reached the end of a symmetric triangle. Look for it to push through 0.225 on the upside and head towards 0.25. On the downside, we could fall through 0.188 and have buying opportunities between 0.188 to 0.166. A move one way or the other should be imminent!
Good luck to all!
-CFT

VETUSD 4H broke out the wedge patternVETUSD 4H
It broke out the wedge pattern.
If the close can higher than pattern and have short upper shadow. (less than 1/3 body)
The stop loss at red line (0.1820).
1st target will be 1(0.2798).
If the close can higher than 1(0.2798).
2nd target will be 1.272~1.382(0.3352~0.3576).
3rd target will be 2(0.4834).

VET breakthrough?VET has been consolidating for the last couple weeks now.
it has created a horizontal channel and has made a double top pattern while testing the resistance line.
let's see what happens but for now, bullish.


Curved Support Line and Fibs. (4hr Heiken Chart)Nothing special, just fib pasta along with an idea about a potential local bottom if the one labeled iv does not hold, and corresponding fib extension (Blue) in that scenario.
There is clear resistance in the 22.4-22.5 range, just under the (orange) 0.618 fib line. This would be the first major resistance i'd like for VET to break before trying to retest the all time high if iv (~$0.185) holds.

Bullish divergenceRunning out of room on the this triangle. just keep an eye on BTC. if it dumps so will everything else.

VET/USD ON THE WAYthe chart shows us a clear bullish signal ,but according to me { not financial advice } ,before breaking the resistance VET will come down to test the support around $ 0.12 and from then break the resistance ..

VeChain- New ATH inboundBINANCE:VETUSD
Fib retracements confirm we are out of the pullback and consolidation period. Downward trendline broken, double bottom on 4hr chart confirmed post breakout of wedge (two green dots on Cypher B indicator, coincide with price action of 4hr chart).
3 confirmations of bottom
-Price action (always look at candles before indicators, rule #1)
-Fib levels held, and price action breakout of downward trend.
-double bottom on 4hr price action with dual confirmation on cypher B at these levels.
.24 is first price target, then look to following fib levels for resistance/ profit taking around .25 <-> .30
Regardless what happens to this coin in the near future, this is THE alt to hold long term, it will change the future of supply chain management by utilizing the power of blockchain.

Potential price action VET.If VET breaks to the upside of the Symmetrical Triangle, we may expect the price to reach the target of 0.36.
Remember: when trading the breakout, wait for a breakout confirmation.
Green= Support
Red= Resistance
Disclaimer: this is not trading advice, trade at your own risk.
Feel free to give me a follow if you want to get notified when I publish a new idea.

VeChain: Cup and handle | VET SUPER BULLISHVeChain went out of the consolidation phase Sunday 02/05. A lot of people thought it would immediately break out.
But VET did something else. He formed a cup and handle.
What is a cup and handle pattern?
William O'Neil's Cup with Handle is a bullish continuation pattern that marks a consolidation period followed by a breakout. The cup forms after an advance and looks like a bowl or rounding bottom.
A summary, I think VET is going to explode after this, it just touched the bottom and I think it will rise a lot when breaking through the second swing high (second triangle).
I really think VET is a top gainer!

VeChain | Short termVechain probability short term ~30% and in some weeks maybe to ~65%
Hope we break the resistance quick, time for some gains.

VET BET12 our, long term. Setup nicely for a bullish inverse head-and-shoulders. Lows to $0.172 are tolerable, and price should return to the neckline at $0.22. Break above green neckline: $0.30 Target.

Bullish Piercing Line pattern formed & engulfing pattern formingWe see a piercing line pattern has formed on the 4h timeline, and a engulfing pattern is potentially forming in the current candlestick. Both signs of reversal into an uptrend.


VET on its way back to previous highsVET has dropped off since its April highs, but that is good news for those of us looking to get back into this excellent project. It has been consistently making higher lows and is in a general up trend. Now is a good entry point since last time VET tried to break .22 the RSI was much less favorable (more overbought). So if we can break the resistance between .21 and .22 then we can run all the way back to at least our previous highs in the .27 range. This is about a 35% move. We'll have to reexamine the chart when we get here. Turning that resistance at .27 into support will be the next challenge.
Stop loss would be a daily close under the trend line. Make sure you wait for the day to end though. VET has a habit of swinging wildly over a single day.
Have fun, trade at your own risk.
