VETUSDT trade ideas

VeChain to much higherVeChain is setting up potential long term trade similar to the trades we took in SOL, AVAX, WOO, Theta etc.
I will be accumulating during pull backs to my buy zone of 0.03910 to 0.04010.
VeChain is setting up multi time frame squeezes and I'm expecting explosive moves to much higher prices. This is a weekly chart so this move will take some time to play out.
My price targets for VET is as follows:
PT1: 0.06480
PT2: 0.09226
PT3: 0.1069
PT4: 0.1490

VET/USDT SHORT-TERM TRADE7-10 day trade, fake out rally and potential return into the $0.044 - $0.046 range.
4 hr RSI hit oversold level of 25 and currently hovering around 35.

jeffans: VETUSDT watching the trendline before 50%+ pumpVETUSDT watching the trendline before 50%+ pump

VET - there's another roughly 45% to goAfter Bitcoin, many altcoins are also returning to their former strength in the year 2024. Among the most attractive altcoins in our view is VET. The price has seen strong gains in recent days and appears far from the end of its rally. We expect VETUSD to rise by around 45% once more before the price begins a noticeable correction.
However, we advise waiting for a decline to around 0.042 before entering a long position. The reason for this is that the daily chart currently appears overheated and should first cool down.
Please note that the trade idea is an approach applicable if one wants to execute the trade "in one go." For day and swing traders, there may be further attractive trading opportunities with better RRRs in the upward direction.

VET/USDT Ready to continue Upward Movement?? VET Analysis Today💎 VET has been a notable focus in the financial market, recently achieving a breakthrough by surpassing a significant resistance area, marked by a strong green candle. Following this breakout, VET has entered a valid retesting phase at what was previously a key resistance, now acting as support. This development indicates a probability for continued upward movement, with our next target being the Bearish OB area.
💎 However, should VET struggle to achieve new highs and sustain its upward trajectory, it might retreat back to retest the support level around $0.0345 in an attempt to gather new momentum. If, during this retesting phase, VET fails to demonstrate a strong bounce or bullish candle confirmation, there’s a risk that it could lose this support level, leading it back towards the lower demand area of $0.0265.
💎 The $0.0265 demand area becomes crucial in this scenario. For VET to resume its upward journey, a strong rebound from this level is necessary, aiming to reclaim and sustain above the resistance level. Conversely, if VET shows a lack of strong response at this demand level, indicating a potential breakdown, it could signal a shift to a bearish trend, possibly leading VET towards a stronger support area.

Got late into Vechain?Are we too late to get into vechain? Of course not! I'm too.
No worries! Here's one of my favorite strategies that trying to catch up!
Vechain has been lagging compares to other alts-coin, BUT what do we do in this case?
Trade within the ranges that the market has given us!
Long at support and hedge against your long at resistance .
Make sure to add your stop-losses.
Take % of the long, and keep the rest! Rinse and repeat until we break either down or up of the range.
"What if vechain never goes ATH? We'll never know, but I'm range trader, and I do not care where prices might go. Miss your set-up? Look for the next opportunity! Don't chase prices, because that's where most traders get rekt!"
Miss the bull-run? No worries, prepare yourself and wait for the next opportunity!

VET Jinny Gann Levels/ Jinny Gann FanzJinny Gann Fan Levels are on the Chart possible Trendlines my WAY.
Jinny Gann Fan/Horizontal Lines Works as Support / Resistance.
Important levels for the Big Cycle on the chart.
Also Still Test in Progress.. Jinny VIP
Trade Wisely.

VeChain longVeChain bounced off the ascending trendline and bounced off the support level. Bullish movement to resistance level at 0.0545 is expected to happen.

VET NEW VOLUME INCREASE Thank you for reading this update.
VET seems to be at an important level, and we will follow if it's able to break in the coming time frames, this could mean high-price actions if it can be done

Vet usdt 1DHello friends, I hope you are doing well.
You can see the vet currency chart in the daily time frame, which has left its long-term downward channel and entered an upward channel that has hit the channel ceiling. Support and resistance points are indicated in the chart


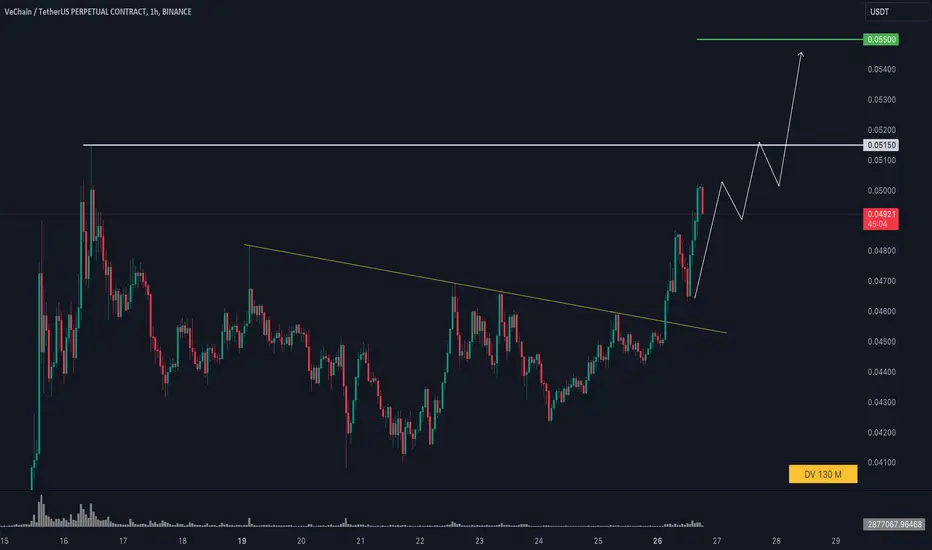
#VETUSDT CONTINUED GROWTH TO $0.55LONG #VETUSDT from $0.0515
1h TF. This instrument is currently in the growth leaders, the upward movement structure continues globally, upon reaching the $ 0.05150 mark, we have started a sideways movement in which the price is currently located, trading volumes are quite high, there is a good price rounding to the maximum of the current growth after the breakdown of the marked hourly slope, I expect to see continued growth after the breakdown of the high with further movement to the level of 0.055$
VETUSDT IDEAUPDATE
Finally #vet Hits Even Surpassed Our Target This Is How Patience & Grip On Technical Analysis Pays Of Breakout Retest & Hits Targets📈

VeChain(VET): Good Drop To Come? VeChain caught our attention with really sweet potential for some drops to happen!!
As BTC is getting weaker currently, it is affecting the VET coin heavily, as you can see.
We are looking for those EMAs and also that middle line of Bollinger Bands as well.
Swallow Team

VET ANALYSIS (BREAKOUT)🔮 #VET Analysis - Breakout 🚀🚀
💲💲 There is a breakout of Symmetrical Triangle Pattern in #VET and trying to retests the level. It's a 4D time frame breakout and we will see more higher price in long-term. If the price perfectly retest the major resistance area then there will be a confirmation of bullish movement in #VET 📈📈
💸Current Price -- $0.04550
📈Target Price -- $0.08494
⁉️ What to do?
- We have marked crucial levels in the chart . We can trade according to the chart and make some profits. 🚀💸
#VET #Cryptocurrency #Breakout #DYOR

Can VET Climb the Wyckoff Ladder? Decoding the ChartThe VET/USD chart shows an interesting development with a potential resemblance to a Wyckoff accumulation pattern. This pattern, if confirmed, could theoretically indicate a move beyond $0.20. However, remember that the crypto market is volatile and reaching this target is not guaranteed. This is not financial advice, and other factors are crucial before investing. What are your thoughts on this potential pattern and its implications for VET?

VET/USDT descending channel upward move? 👀 🚀
💎Paradisers! Our focus shifts to #VETUSDT as it navigates a descending channel, now nearing channel resistance with a strong bullish outlook.
💎 Throughout its path, $VeChain has been tracking along a descending channel but is currently setting its sights on the supply level at $0.05438. A breakthrough above the channel resistance and subsequent maintenance of upward momentum could herald a bullish journey towards the $0.05438 supply level. Surpassing this supply could open the doors to targeting even higher major supply zones.
💎 For the astute traders among us, should the upward trajectory begin to lose steam, keep an eye out for a potential bullish resurgence from the support level at $0.03812. Falling beneath this mark could indicate a transition towards bearish conditions.

$VET FALLING WEDGE- BULLISH CONTINUATIONVechain has now developed a very nice falling wedge which is soon to break to the upside.

$VET BULL PENNANT- TARGET 0.064CRYPTOCAP:VET has formed a nice bull pennant. Looking for a continuation after a successful breakout-retest from this pennant.

VET/USDTITS GOOD LONG RIGHT NOW AFTER breakout OR U GUYS ALSO CAN hold in spot its . Good COIN TOO LONG IT with 35X good coin for us

VETUSDT ANALYSIS As a novice in the realm of analysis, I've recently delved into analyzing VETUSDT using Fibonacci retracement levels on the weekly timeframe. My approach involves identifying key resistance levels and setting targets accordingly.
Given my beginner status in analysis, I am eager to receive your insights and feedback on my method and conclusions. Additionally, I would greatly appreciate any guidance or suggestions you could offer to help refine my approach.
Thank you for taking the time to consider my analysis and share your expertise. Your feedback will play a crucial role in my growth as a trader.
Warm regards,

VETUSDT.1DBased on the provided market data, the VET/USDT pair is currently trading at a price of 0.042 USDT. The 4-hour chart indicators show that the relative strength index (RSI) is at 41.24, which suggests that the cryptocurrency is neither overbought nor oversold. The moving average convergence divergence (MACD) is at 0.00010, indicating a relatively balanced market with no clear signs of a bullish or bearish trend.
The Bollinger Bands (BB) on the 4-hour chart is at 0.046, indicating moderate price volatility. The support levels on the 4-hour chart are at 0.039, 0.038, and 0.035 USDT, while the resistance levels are at 0.044, 0.048, and 0.050 USDT.
On the daily chart, the RSI is at 68.61, which is approaching overbought territory, suggesting that a price correction might occur in the near term. The MACD is at 0.0043, which shows a slightly bullish market. The BB is at 0.04852, indicating moderate price volatility. The support levels on the daily chart are at 0.038, 0.034, and 0.032 USDT, while the resistance levels are at 0.046, 0.051, and 0.055 USDT.
On the 7-day chart, the RSI is at 79.04, which is in the overbought territory, suggesting a possible price correction in the future. The MACD is at 0.0045, which shows a bullish market. The BB is at 0.04853, indicating moderate price volatility. The support levels on the 7-day chart are at 0.033, 0.026, and 0.020 USDT, while the resistance levels are at 0.074, 0.081, and 0.088 USDT.
In conclusion, the market data suggests that the VET/USDT pair is currently in a balanced state with a slight bullish bias, especially in the long-term (7-day) perspective. However, the relatively high RSI on the daily and 7-day charts suggests that a price correction might occur in the near term. As always, it's important to consider other factors and conduct further research before making any investment decisions.
