VETUSDT trade ideas

VETUSDT is creating a pennantVETUSDT is showing signs of potential weakness.
The market has created a pennant formation after bouncing on the 0.020$ area and creating a new bullish impulse.
Currently, the price is testing the 4-hour resistance on the 0.024$ area, which is a critical level for traders to watch. If the price creates a new bullish impulse and retests the 0.5 Fibonacci level, where the price has liquidity, it could create a new bearish impulse until the daily support at 0.017$ area.
According to Plancton's rules, if the price breaks below the daily support at 0.017$ area, a new short position may be possible. This is because the breakdown from the support level indicates that the bears have gained control, and there is potential for the price to continue moving lower.
–––––
Follow the Shrimp 🦐
Keep in mind.
🟣 Purple structure -> Monthly structure.
🔴 Red structure -> Weekly structure.
🔵 Blue structure -> Daily structure.
🟡 Yellow structure -> 4h structure.
⚫️ Black structure -> <= 1h structure.
Follow the Shrimp 🦐

It will be available for purchase soonThe analysis for the time frame is low. Be sure to look for a purchase in the specified area with confirmation, and also be careful. All efforts are made to give the right mindset to the audience. If there is a question, be sure to comment and ask.

VET aiming highVechain is a prime example of why blockchain technology should be appraised rather than shunned, even the US government agrees that blockchain technology has big use cases in this current world. the devs over at Vechain are trying to solve real-world issues. one article I recently read stated that they will try to integrate blockchain technology into an outdated system that is the global shipping chain, in a 14 trillion dollar market. with bibles of paperwork needed to get filled out in order to get a shipping container out of port and into another country. if the shipping companies would integrate this tech it would mean they would have a foolproof ledger system keeping track of all the shipping history and for the environment, no more paper.
only time will tell if this will get integrated with the current structure. Due to the current crypto regulation scrutiny, it will be hard to get a foot in the door. but if they do manage to persuade the transition we will probably see Vechain at the top in the crypto space.
China where Vechain has its roots is gradually opening up its doors to crypto, the talks surrounding hong kong as the new crypto capital might light some hope for this potential project


VETSalaam
VET breaking the descending parallel channel. (a 4h candle close above will confirm breaking)
The projected target is about 15% higher, coinciding with a key level.
Manage the risk and good luck

VeChain shortVeChain broke trough the ascending trendline. Asset broke trough the support level. Bearish movement to support level at 0.0195 is possible.

#VETUSDT #LQR #TOBTC #LaqiraProtocol ● The price is in an up trend
• If the bottom of the channel supported and confirm , the first resistance is in the Level of 0.02500-0.02600.
• And the Level of 0.02700-0.02800 next resistance contains the orders
• After the confirmation , you can sell at the listed resistances
• If the channel breaks and you get confirmation, you can sell up to the support Level of 0.02200-0.02100.
• The next support is in the level of 0.02000 - 0.01950. If confirm, you can buy the mentioned supports.
● This analysis is not a buy or sell offer

VET Bullish triangleThe coin is in the game, it is traded at increased volumes of 100 million, at the moment we are squeezed in a triangle, within which we made a false stabbing of its lower and upper borders, thereby testing the poi zone valid for searching long positions and collecting all local retail stops.

VeChain (VET) formed big bullish Gartley for upto 39% pumpHi friends, hope you are well, and welcome to the new trade setup of VeChain (VET) coin with US Dollar pair.
Previously I shared a long-term trade setup for VET, which is still in play as below:
Now on a daily time frame, VET has formed a bullish Gartley move for another price reversal. (due to extreme sell-off, priceline broke down the potential reversal zone and it was likely to behave like a bullish Butterfly move, but recovered soon, and still it can behave like a bullish Gartley )
Note: Above idea is for educational purpose only. It is advised to diversify and strictly follow the stop loss, and don't get stuck with trade

VETCHAIN: $VET UPSIDE DISTRIBUTION? 🔔$VET has been trading in this range since weeks, there was some upside momentum because of partnership announcements but not enough for a breakout of this box.
I personally prefer these accumulation phases because it helps me get in with an accurate calculated risk, my SL is few % below the box and TP is partially set at every 20% rise.
This is my risk management method and everyone has his own way.
I will keep updating this in here, make sure you follow me to get price movement alerts!

VET potential is HUGEVechain (VET), a leading enterprise-focused blockchain platform, has recently displayed significant bullish momentum as it crosses the crucial 200-day Exponential Moving Average (EMA) line. This key technical indicator is a vital sign for many traders and investors, as it often signals a potential shift in the market trend. Additionally, the Supertrend, a popular trend-following indicator, is on the verge of turning green, further reinforcing the positive outlook for VET. These confluence factors suggest that VET may be entering a new growth phase, presenting an opportune moment for those looking to capitalize on its potential upside. As always, investors are advised to conduct thorough research and consider their risk tolerance before making any investment decisions.

VETUSDT ,Descending to ascendHello my friends
vechain has finished its price correction and could be at the beginning of motivational waves, from where it has hit a resistance level , I expect a decline and then a strong rise.
I would be happy to see your comments.
Be happy, healthy and wealthy.

VET/USDT Waiting For 14% Drop!Hey, guys ✌️
VET/USDT is last coin we want to share with you today. Currently third time touching that support zone we see a chance of breaking it where price already passed that 100EMA zone. We won't keep it long here, wait for price to secure below this line and we good for short BUT there is also a chance for that 200EMA to be touched before we move to lower levels!
If you like ideas provided by our team you can show us your support by liking and commenting.
Yours Sincerely,
Swallow Team 🔱
Disclamer:
We are not financial advisors. The content that we share on this website are for educational purposes and are our own personal opinions.

VET 15M LongVET USDT - 15 M - Wait For Trend To Happen Then Can Open Trigger -Its Work For Me - Have Secret

V for Vet ⚔️ - Analysis #4/50Hello TradingView Family / Fellow Traders. This is Richard, also known as theSignalyst.
on DAILY: Left Chart
VET is overall bearish, however we are approaching a strong demand zone and previous major high. So we will be looking for buy setups on lower timeframes.
on H1: Right Chart
VET is bearish from a short-term perspective trading inside the falling red channel.
🏹 Trigger => for the bulls to take over, we need a new high to form and then a break above the upper red trendline and red zone.
Meanwhile, until the buy is activated, VET can still trade lower till the 0.02 - 0.021 demand zone.
📚 Always follow your trading plan regarding entry, risk management, and trade management.
Good luck!
All Strategies Are Good; If Managed Properly!
~Rich

Vet to the Moon!this would be aa crazy call, if this follows in chinas other crypto footprints, akaa NEO, we could potentiall see this pushing $100 someday in the future. ggs
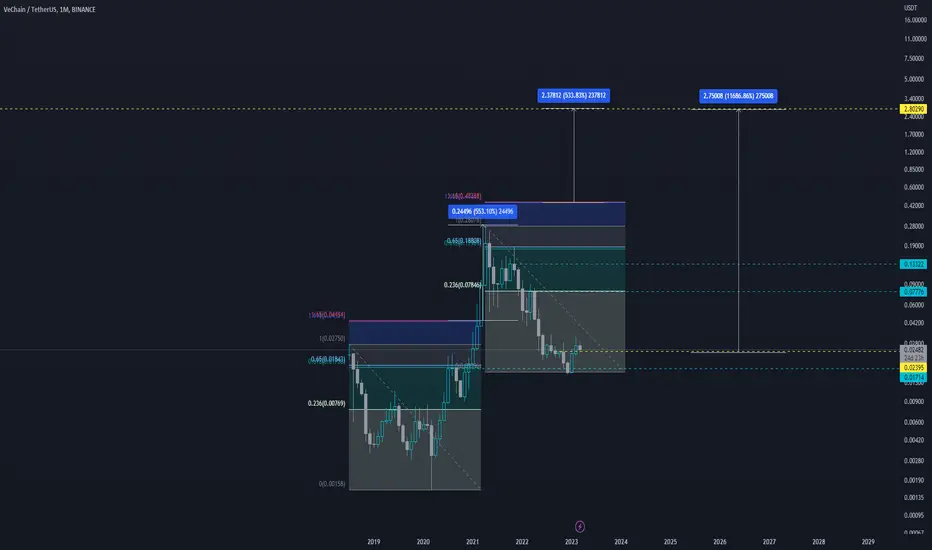
VECHAIN - Important Update!From looking at Vechain on a log chart, we can see that we're still within the ABC correction.
in every ABC correction, C wave is almost always 5 waves, which follows the impulsive schematic.
We are now in wave 5 and we're expecting to see 5 clear waves down.
An important thing to note is that in Elliott waves , wave 3 can never be the shortest. At the moment, wave 1 is longer than wave 3. Therefore it is highly likely that wave 5 will be shorter than wave 3. This gives us a clear zone to look at for LONG orders.
Trade Idea:
- For experienced traders, count 5 waves down for wave 5 and enter on the breakout of the 5th wave
- For less experienced traders, watch for 5 waves down and draw a descending trendline and enter on break of trendline
- Targets: 0.1, 0.23, HODL the rest and manually close
Goodluck and as always, trade safe!

VET Short term swinggRange 40 % nice R/R planse set using order blocks. I write a bit more so i can upload it.

VETUSDTCame nice back above massive weekly level, flipped the level perfectly. Now looking to enter at black line being next support level
Spot , 5% stop, possible 30 to 60 % gain

VETUSDT 40.75% ✅#VETUSDT
Target 3️⃣ : done✅
Entry price: 0.02314$✅
Price reached : 0.03257$ ✅
Profit: 40.75% ✅🚀🚀🤑

VETUSDT on daily support and may head up for 0.02918VETUSDT is trading inside daily support zone. It is likely that the price will trade higher and aim towards daily resistance. The expected movement has been depicted in three steps L1, S2, L3. The step L3 may go till 0.02918 as depicted on the chart. But this sequence of paths will be followed only if the price does not lose the daily support.

VETUSDT Short TradeConfluence for Short Trade
1. Respected Downward Trend line
2. Below 200EMA
3. At Fibo Golden Zone
4. Candle Rejections
5. Rejected the Level of Resistance
Trade at your own risk my analysis might not work all the time make sure you review also the market and analyze by your self 😊😊
Happy trading trading everyone✨✨
