HEAD AND SHOULDER FORMATIONHead and shoulder have been formed on 1H timeframe ... make your positions for some good short ride.
VETUSDT trade ideas

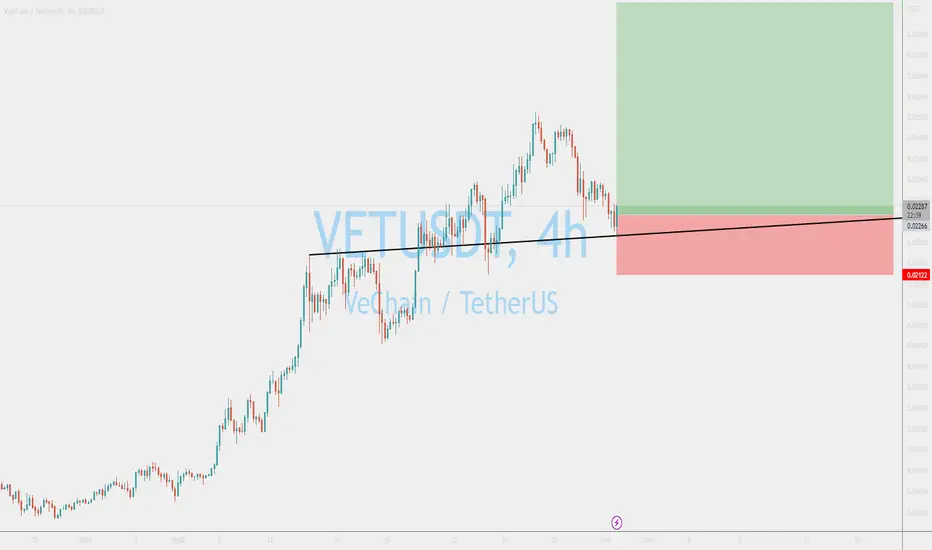
VET/USDT 4 HOUR SHORT----------------------------------------------------------------------------------------------------

#VETUSDT 6H Chart
Price had tapped perfectly into a daily supply zone where it got rejected from. MACD is bearish, RSI is sold and EMAs are bullish. I expect price to keep moving down and reach the discounted 6h demand zone around $0.0255 where we would be looking to long from.

VET is still very bullish!Hey guys, if you followed my previous TA you made a lot of profits. Congrats with that. So whats next for VET?
- VET is still on a higher timeframes in a uptrend. Remember that the trend is your friend.
- We finally managed to break the 200 EMA.
- Plus were moving in my Brown box with decent volume.
- We didnt break out of the Brown box. But eventually we will…
- After that we could move to the next resistance at 0,03385.
Greet times and profit ahead! Leave me a like and follow me to keep updated!

VeChain (VET) - already 97% performance, more to come!#VET / USDT TA Update:-
$VET currently trading at $0.030
Our CTT (Coinlion Trend Trader) Indicator told us to enter VET at $0.01811.
VET broke the descending channel (since may 2022) around $0.02451 and give us then a 65% growth potential.
We still have 23% growth potential.
Our entry point (01/11/2023) : $0.01811
Target point : $0.039 (140% profit)
What do you think ?
Please click LIKE button and Appreciate my work.
Coinlion Trend Trader indicator tells me
- When to enter short or long
- When to exit and take profit :-)
- You can see it in action if you want
If you want it or my SL indicator or My Liquidity Support and Resistance Indicator, let me know.
Thank you.


VeChain/USD 1H - Bullish Trend VeChain/USD in one hour time frame is in bullish trend as it continues to make higher high and higher lows. If the price breaks above the previous higher high, it will be a sign of bull trend continuation. In this case we can open a long trade.

VET/USDT (Vechain)Hello my friends
vechain has finished its price correction and could be at the beginning of motivational waves, from where it has hit a resistance level, I expect a decline and then a strong rise.
I would be happy to see your comments.
Be happy, healthy and wealthy.

VETUSDT rally beginsThis is the time and moment when cryptos are going to get wild, get ready for the ride, VETUSDT looks super bullish!

#VETUSDT #LQRUSDT #TOBTC #LaqiraProtocol important static resistance and fibo level at price $0.03387
next resistance fibo 1.618 at price $0.03657
minor support $ 0.02688
fibo and static support $0.02426

$VET/#USDT [#VeChain]: Resistance_BreakoutHey traders, we've identified a Resistance Breakout on the $VET / $USDT chart. The price has broken above a key resistance level, which can indicate a potential bullish trend. Taking in consideration the next resistance key levels are at 0.02593 | 0.02829 | 0.03221 and the major support zones are respectively at 0.02201 | 0.02045 | 0.01653. It is a bullish indication and we may consider entering at the current price zone at 0.02546 and targetting higher levels.
Technical Metrics :
Current price: 0.02546
24H Volume: 13,255,198.8164 ₮
24H Price change: 8.433%
- Pivot Points - Levels :
Resistance: 0.02593 | 0.02829 | 0.03221
Support: 0.02201 | 0.02045 | 0.01653
Indicators recommandation :
Oscillators: SELL
Moving Averages: STRONG_BUY
Technical Indicators Summary : BUY
- In-depth VETUSDT technical analysis on > Tradingview TA page
What do you think of this analysis? Share your insights and let's discuss in the comments below. Your like, follow and support would be greatly appreciated!
Welcome to the home of charting big: TradingView
Benefit from a ton of financial analysis features, instruments and data. Have a look around, and if you do choose to go with an upgraded plan, you'll get up to $30.
Discover it here

VET Broke Up and Retested Major ResistanceVET has finally broken 100 Daily EMA and a strong sloping resistance since May last year (only one false breakout had ever happened, just right before FTX). This is because BTC is also pumping hard (BTC.D is high)
After the breakout, VET retested both said sloping resistance and 100 Daily EMA, and now it has broken previous high before the pullback,
and also managed to close daily above Ichimoku Cloud with a huge bullish momentum bar (also worth pointing that Ichimoku Cloud forecast is green, sharply pointing up)
Also, Daily 20 and 30 EMAs have crossed above Daily 50 EMA and are about to cross Daily 100 EMA as well
If BTC moves up or sideways, then the next target would be around $0.025 which is also where 200 Daily EMA is
(the last time VET managed to successfully break through 100 Daily EMA was in March last year, where it reached 200 Daily EMA and did a false breakout above it)
If BTC moves down/does a correction, then most likely VET will retest $0.02-$0.021 level again
Key Events: Lunar New Year on Sunday and Weekly Close on Monday
Future targets/key points are marked as red lines on the chart
Happy Trading
Not a Financial Advice


Vet update - first target reachedOn the 28th of Jan I stated that VET has potentially bottomed as it had broken out of it's bear market trendline resistance and that it was probable that we would test the highs that VET made in Nov (black line)
As of today VET has had a daily close above this level, if bulls can hold this level then it's probable that VET will attempt to test the highs it made in June and August (red line) in the near future.
Trade safe Trade green


VETUSDT at the supportVETUSDT continues to look bullish and while the price holds the trendline we should see the continuation of the uptrend.

#VETUSDT 6H Chart
Price had previously bounced off the 4h demand zone around $0.0225 and it is currently still moving up. MACD is bullish, RSI is bought and EMAs are neutral. I expect price to tap into the major 4h supply around $0.025 and move down from there.

VET/USDT still in sideways movementHey, guys ✌️
VET coin is the last from cryptos we will be looking into today. We see that price is still inside the sideways path where we move from one side to another resulting a nice, smooth, and calm movement. Currently we are waiting for price to reach the upper size of that path where we will be looking for a potential short position.
If you like ideas provided by our team you can show us your support by liking and commenting.
Yours Sincerely,
Swallow Team 🔱
Disclamer:
We are not financial advisors. The content that we share on this website are for educational purposes and are our own personal opinions.

VET LONG SETUPHi, dear traders. how are you ? Today we have a viewpoint to BUY/LONG the VET symbol.
For risk management, please don't forget stop loss and capital management
When we reach the first target, save some profit and then change the stop to entry
Comment if you have any questions
Thank You

VET USDT spotVET is looking very nice here after retaking the big weekly resistance. This week we can dump bit further to deviate back below weekly line, maybe towards 2000/2100. DCA from red to max 2000 seems solid.
Then weekly needs to close above the red imo to continue up.

Trendline support holding for VETVET is currently holding an upward trendline support and a downward trendline resistance. If the first trendline support breaks, there is a second trendline support.
Entry at 0.01822 - 0.0155.
Immediate target is sitting at the horizontal resistance at 0.0154
Stop Loss: Daily closure below 0.0109

Vechain bear market rally is almost curtains...Very lonely being a bear up here but it is what it is... macro descending channel not invalidated just yet
