VETUSDTHello Crypto Lovers,
Mars Signals team wishes you high profits.
This is a one-day-time frame analysis for VETUSDT
In this chart, we have R2 that used to be a support area and R1 is our resistance area which represents the unsuccessful attempts of the price to rise. S2 used to be a resistance area and S1 used to be a resistance line, as well and Also S2 is our support line that shows the support of the price at some points. Here we have the fluctuation of price below R1. Our prediction would be a fall toward S2 and here by having some rising signs, we will consider the long position and then we expect a rise for the price to R1 or even higher. If the price possibly moves below S2, then more decline will happen for it.
Warning: This is just a suggestion and we do not guarantee profits. We advise you to analyze the chart before opening any positions.
Wish you luck
VETUSDT trade ideas

Vechain 40% pump incomingHi traders vechain has broken out of this trendline that it dod not before so make sure you check the retest.

VETUSDTDISCLAIMER:
This is not financial advice! This is an opinion-based show. I am not a financial adviser. Please only invest what you can afford to lose, and we encourage you to do your own research before investing.
everyone should buy and sell according to their own strategy.
Everything you need to know is outlined in the chart and keep in mind that we are moving forward with probabilities and the analysis may be wrong so take capital management seriously.

VETUSDT our eyes on VETUSDT. we want to see a break above the purple zone and target 0.04 -0.065
tarde safe but do your own research ;)

vet/usdt Hello to all friends.
This currency can grow significantly after the specified area, it can grow to the next areas
Currently, it is possible to improve, but overall, it can have a good growth ahead.
Good luck .

Retest and Go🫰Hi everyone,
I hope you are doing well.
Yesterday we talked about how DOTUSDT was doing a Flip pattern by retesting the last resistance as support.
Today was a really bullish day as it did what we analyzed and agreed on yesterday on TradingView.
In short, I expect the price to pull back to the last support, the same one that it bounced from. The reason is that the price just removed the liquidity that was accumulated in the last high.
If we consolidate at the resistance that we are in right now, then I expect a rally to the upside.
So we basically have 2 scenarios that we might expect until the end of the week.
Please comment if you have any questions, I will try my best to answer them.
Thank you😊

bullisHello, I want to share this drawing with you and I want your opinion, and it is also not investment adviceHello, I want to share this drawing with you and I want your opinion, and it is also not investment advice

🔥🔥🔥Bullrun for VET 🔥🔥🔥Hey guys !
Pay attention to this 👇🏻
Thjs is LONG SIGNAL for VET
Entry: 0.0241
Stop loss : 0.0228
Tp1 : 0.076
Tp2 : 0.178

VETUSDT Awesome oneHey everyone
The VeChain it's an amazing coin for real!
Right now we are waiting the real pump with all market!
Add coin to your watchlist!
Best wishes.

Awesome Coin|I like the VeChainThis coin of course will pump with all market
So we have to wait the start of the pump and start to buy.
Now is the awesome moment and very good buy zone to make Long
I like this coin it is good for real!
VETUSDT
Add this coin to your watching list and follow the updates
Best wishes

Vet update , cautious Now before we start you need to see the situation of btc before any alts coins , now about vet .. as you can see failed to breakthrough the resistance, and we have free path no resistance and no support , be cautious that if we get back inside the trend .
Happy trading and I’m happy to receive thoughts:)

UPDATE: VET UP 29% after bullish signal - Ready for 148% 🚀🚀🚀VET pumped 29% (green price range) after the bull Supertrend Ninja - Clean signals (green vertical line on the background). VET is forming Leg A with a possible bull run to around to 0.063 USD (0.618) or 0.054 USD (0.5). Which is about 148% (orange price range) possible gain.
VET is breaking out of the Ichimoku Cloud , which is considered bullish. The RSI is starting to warm up for a bullrun at 73. RSI Brown at 96. If we take a look at the Average Directional Index ( ADX DI) its in the bullish zone, now starting to move sideways. Currently VET is above its Basis Bollinger Band, Band Basis 20 Period SMA . And above the LSMA as well.
I see more bullish than bearish elements. Since VET price and the RSI are still forming a higher low. Which is a bullish sign as well. Let the GAINS begin !!
Remember to always take profits and use proper risk management!
Thank you for reading.
Namasté 🙏
Disclaimer: Ideas are for entertainment purposes only. Not financial advice. Your own due diligence is highly advised before entering trades. Past performance is no guarantee of future returns.
What Indicators Do I Like To Use:
I am using the "Supertrend Ninja - Clean", which is a trend-following indicator (Green and red vertical lines on the background). When the background of the candlestick closes green (vertical line). It indicates a possible bullish (up)trend. And red for possible downtrends.

VETUSDT BAT Bat
The Bat Pattern is a 5-point retracement structure that was discovered by Scott Carney in 2001. It has specific Fibonacci measurements for each point within its structure and it is important to note that D is not a point, but rather a zone in which price is likely to reverse, called the Potential Reversal Zone (PRZ). The B point retracement of the primary XA leg must be less than a 0.618, preferably a 0.50 or 0.382 and the PRZ consists of 3 converging harmonic levels: 1) 0.886 retracement of the primary XA leg, 2) extended AB=CD pattern, usually 1.27 AB=CD and 3) minimum BC projection is 1.618.
The first target would be the 382 retracement of AD and the second target the 618 retracement of AD. A common stop level would be behind the X-point. Conservative traders may look for additional confirmation. Bat Patterns can be bearish and bullish. TradingView has a smart XABCD Pattern drawing tool that allows users to visually identify 5-point reversal structures on a chart.

VETUSDT DAILY ANALYSIS (longtermview)Hello my fellow Traders and Investors,
This is my daily outlook on this pair.
Price created a strong bullish impulse creating a new high and an active level of Demand.
I expect price to retest this active demand and continue in a bullish direction
However, this is a probable outcome, anything can happen.

VETThe price rose to the upper limit of the rising wedge. Bearish divergences have formed, RSI has strong resistance. The price may fall to the lower border of the wedge

VETUSDT BAT FORMATIONBat
The Bat Pattern is a 5-point retracement structure that was discovered by Scott Carney in 2001. It has specific Fibonacci measurements for each point within its structure and it is important to note that D is not a point, but rather a zone in which price is likely to reverse, called the Potential Reversal Zone (PRZ). The B point retracement of the primary XA leg must be less than a 0.618, preferably a 0.50 or 0.382 and the PRZ consists of 3 converging harmonic levels: 1) 0.886 retracement of the primary XA leg, 2) extended AB=CD pattern, usually 1.27 AB=CD and 3) minimum BC projection is 1.618.
The first target would be the 382 retracement of AD and the second target the 618 retracement of AD. A common stop level would be behind the X-point. Conservative traders may look for additional confirmation. Bat Patterns can be bearish and bullish. TradingView has a smart XABCD Pattern drawing tool that allows users to visually identify 5-point reversal structures on a chart.

V chain sell chartMade this to remind myself to tkae profits on the way up this time with Vet. LFG!!!

VeChain (VET) - August 4hello?
Welcome, traders.
By "following", you can always get new information quickly.
Please also click "Like".
Have a good day.
-------------------------------------
(VETUSDT 1D Chart)
Resistance: 0.04214-0.05546
1st support: 0.02299-0.02452
Secondary support: 0.01840
The 0.04216-0.05546 interval is the interval that determines the trend.
Therefore, the important key is whether it can be supported by rising to the 0.04216-0.05546 section.
To do this, we need to check if it can be supported by rising to the 0.02949-0.03286 section.
If it falls from 0.02299 and is resisted, it may lead to further declines, so a Stop Loss is needed to secure cash.
------------------------------------------------------------ -------------------------------------------
** All descriptions are for reference only and do not guarantee a profit or loss in investment.
** The MRHAB-T indicator, which is inactive on the chart, contains indicators that indicate support and resistance points.
** Background color of Long/Short-S indicator: RSI oversold and overbought sections
** Background color of CCI-C indicator: When the short-term CCI line is below -100 and above +100, oversold and overbought sections are displayed.
** The OBV indicator was re-created by applying a formula to the DepthHouse Trading indicator, an indicator disclosed by oh92. (Thanks for this.)
(Short-term Stop Loss can be said to be a point where profit and loss can be preserved or additional entry through split trading. It is a short-term investment perspective.)
---------------------------------

VETUSD Scythe PatternA scythe pattern which is a bullish continuation pattern along this white uptrend

Roadmap $vechainRemember to always, always place your stop loss at the appropriate levels immediately after you have put in your long/short position so as not to get stopped out at your trades.
>>>>> Always be prepared for either scenario of upwards movement, downwards movement, or sometimes even sideways movement (consolidation phase & sometimes even extended consolidation phases). <<<<<
Constructive and positive comments are welcome.
Consider leaving a like after viewing my post, and click on Follow to receive my latest and updated posts

$VET- updatebuy as close to the thick red line ( close below that is invalidation) , close above the yellow line or 50 ma would confirm smooth sailing till targets above.
not in this trade but looking good , possible lever and leave for a while trade .
VeChain (VET) Price Prediction 2022 VeChain (VET) Price Prediction 2022
VeChain holds the 37th position on CoinGecko right now. VET price prediction 2022 is explained below with a daily time frame.
The above chart of VET laid out the horizontal channel pattern, also known as the sideways trend. In general, the horizontal channel is formed during the price consolidation. In this pattern, the upper trendline, the line which connects the highs, and the lower trendline, line which connects the lows, run horizontally parallel and the price action is contained within it.
A horizontal channel is often regarded as one of the suitable patterns for timing the market as the buying and selling points are in consolidation.
Currently, VET is in the range of $0.02545. If the pattern continues, the price of VET might reach the resistance level of $0.03322. If the trend reverses, then the price of VET may fall to $0.02361, and $0.02071.
VeChain (VET) Support and Resistance Levels
From the above daily time frame, we can interpret the following as the resistance and support levels of VET.
Resistance Level 1 $0.02667
Resistance Level 2 $0.03366
Resistance Level 3 $0.04358
Resistance Level 4 $0.06823
Support Level 1 $0.02025
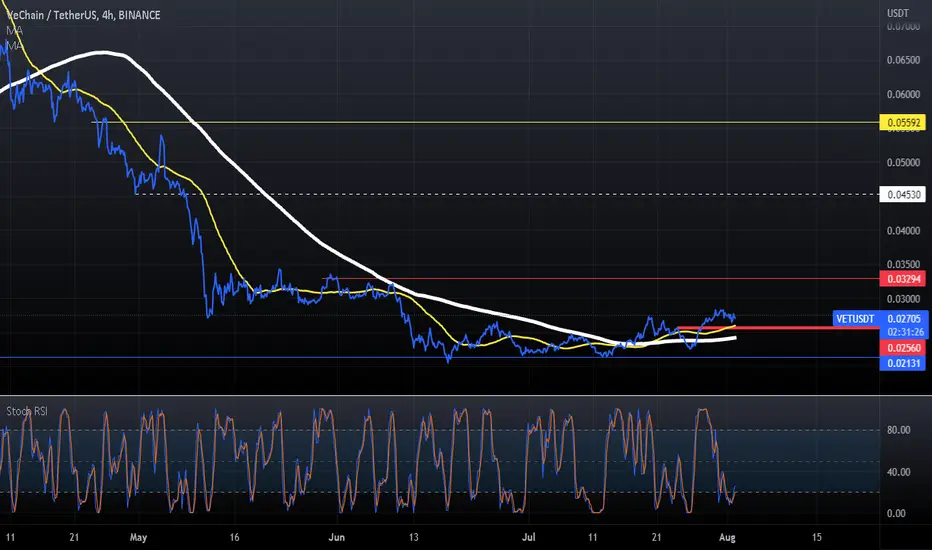
VET Resistance & Support Level

VetUsdt 4h is about on resistance, Vet Usdt on 4H TF testing is strong resistance , imo will break out, as vet on Weekly TF breakout trend already...
