VET looking for support as divergence forms. VET is approaching strong levels of support. There are signs of bullish divergence on momentum and trend oscillators. Although this is a good sign a chofch would confirm a pivot to the upside. DCA
VETUSDT trade ideas

VETUSDT 1WVET ~ 1W Analysis
#VET Buy gradually from here if you still have a Conviction on this coin with a short -term target of at least 20%+.

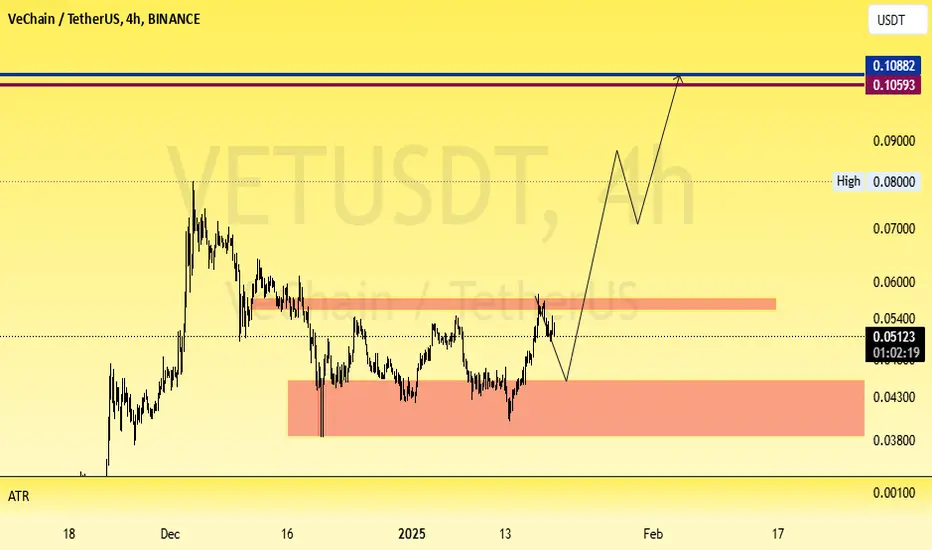
Cup and Handle pattern!Analysis 🚨
NYSE:VET is forming a Cup and Handle pattern! ☕ If it breaks out of the red resistance zone 🔴, the next targets will be:
🎯 First Target: Green line level 🟩
🎯 Second Target: Blue line level 🔵

UNIVERSOFSIGNALS | VET : a Layer 1 projectLet's quickly dive into VET, a Layer 1 project with a market cap of $2.37 billion, currently ranked 41st in coin market cap.
📊 In the 4-hour timeframe, you can see that a descending triangle has formed, and the floor of this triangle at $0.03068 has been broken, with the price now touching an important daily support at $0.02673.
⚡️ The RSI oscillator, following the triangle break, entered the oversell zone and, after concluding the downward leg, has rebounded above this zone, approaching the 50 area.
⭐ The volume aligns with the downward trend, and if the support at $0.02673 breaks, we could witness the next leg down. The next price support would be at $0.02406.
📈However, if the price moves back above $0.03068, it could indicate that the downward trend has ended. In this case, a risky long trigger would be at $0.03580, and the main long trigger would be at $0.03958. This reversal would suggest potential upward momentum, providing opportunities for long positions.

Be careful with VET !!!The price drops to around 0.305 and then pumps to 0.39 cents.
and if this wedge is broken, you will no longer see cardano below 30 cents.
Give me some energy !!
✨We spend hours finding potential opportunities and writing useful ideas, we would be happy if you support us.
Best regards CobraVanguard.💚
_ _ _ _ __ _ _ _ _ _ _ _ _ _ _ _ _ _ _ _ _ _ _ _ _ _ _ _ _ _ _ _
✅Thank you, and for more ideas, hit ❤️Like❤️ and 🌟Follow🌟!
❗Disclaimer
⚠️Things can change...
The markets are always changing and even with all these signals, the market changes tend to be strong and fast!!

VET buy/long setup (4H)VET appears to be bullish.
We are seeing higher lows within the RANGE.
It can move from the demand zone toward the targets on the chart.
A liquidity pool is also visible on the chart, which we have marked.
A daily candle closing below the invalidation level will invalidate this analysis.
Do not enter the position without capital management and stop setting
Comment if you have any questions
thank you


#VET/USDT#VET
The price is moving in a descending channel on the 1-hour frame and is adhering to it well and is heading to break it strongly upwards and retest it
We have a bounce from the lower limit of the descending channel, this support is at a price of 0.03165
We have a downtrend on the RSI indicator that is about to break and retest, which supports the rise
We have a trend to stabilize above the moving average 100
Entry price 0.03342
First target 0.03500
Second target 0.03712
Third target 0.03979

VETVET-USDT
Buy entry from the current price with a part 🟢
If there is a correction, we enter from the price of $0.032410
Targets:
$0.036870
$0.043400
$0.053100
Stop loss:
$0.031000

VeChain: A New Cycle Starts, Patience Is Key To Win!The correction is over, a new cycle starts.
If we consider the start of the bull-market after the bottom hit early June 2023, we can say that VETUSDT (VeChain) is about to the enter a major bull-run wave. Two reasons why: First, the action in late 2023 early 2024 was strong. Second, in 2021 VETUSDT peaked early, in April. This means that there is the possibility of VETUSDT also peaking "early" in 2025. If that's the case, the next three months can be the bull-run phase-wave.
This is just a possibility because we are in uncharted territory. With Cryptocurrency going mainstream now and the world changing now the bull-market dynamics we are used to and already know might change. The possibility of change is an appealing one but we cannot act or plan based on assumptions so we have to go with what we know. We know the market is bullish now and regardless of how the coming b-wave develops we will have massive growth.
I am seeing potential exceeding 1,500%.
From bottom to projected top, this would mean around 5,000%. These are very rough numbers just for illustration.
Let's go a bit deeper and consider the chart.
In mid- to late 2020 there was a stop within the bull-market followed by a bull-run phase. A falling wedge pattern developed and this is exactly what we have today. This is marked blue on the chart.
Back in 2020-2021 the bull-market was really steep, but this time the rise is not as steep as before. This can be translated in several ways. The bull-market might last longer, because a steep rise tends to end by surprise. A more controlled, balanced rise leaves behind more support and this in turn can support longer periods for growth.
VeChain is not trading at bottom prices. It is trading ~150% higher compared to June's 2023 bottom low. This means that this is a pair for a strong project. A strong project is expected to grow strong in a bull-market year like 2025.
I have never been in Crypto without being surprised.
The down-wave took us by surprise and went further and for longer than anything we expected to see. The up-wave can do the same in reverse, what if VETUSDT reaches a new high, so high that we cannot yet conceive how high the next peak price will be.
It is all good with me.
As long as we get a great entry, with great timing, we can end up in the green.
Patience is key to win.
Namaste.

TradeCityPro | VETUSDT Volatile Week Begins👋 Welcome to TradeCityPro Channel!
As the global market opens, let's analyze VETUSDT and prepare for the upcoming trading week.
🌐 Overview Bitcoin
Before diving into VET, let's check Bitcoin’s 1-hour timeframe. The market was expectedly quiet on Saturday, given the lack of trading activity.
My plan remains the same: If $95,747 breaks, I will open a short position. If Bitcoin dominance is rising at the time of the breakdown, I will short both BTC and an altcoin that is weak against Bitcoin since it has a higher chance of dropping.
📊 Weekly Timeframe
VET is one of the older altcoins in the market, and its current situation is relatively better than many others.
After breaking $0.03147, it had a sharp bullish move up to $0.06672, but it's now in a correction phase and has settled back on the $0.03147 support.
A positive sign is that VET has formed a higher low in 2024 compared to 2023, which suggests potential strength.
For a spot entry, we need to see a new structure forming, and my current buy trigger is a break above $0.06622. Until then, I see no buying opportunity. For selling, if we drop below $0.01470, it's best to exit and go to cash.
📈 Daily Timeframe
On the daily chart, VET initially broke above the $0.02679 range high and rallied sharply to $0.06828. However, we saw a fake breakout, leading to a heavy rejection and correction.
During this drop, a midway range (box) between $0.04214 - $0.05288 formed. Buyers tried but failed to break above the box, resulting in another fake breakout, increasing the likelihood of breaking the range low.
After another rejection from the mid-range, $0.04214 (our spot exit trigger) was broken, leading to a sharp decline. The RSI is now oversold, indicating a potential slowdown before further downside into the previous daily range.
⏱ 4-Hour Timeframe
On the 4-hour chart, we have formed a key level that is currently breaking down, creating a short opportunity.
📈 Short Position Trigger
we can place a stop-sell order with the current 4-hour candle as confirmation. I have already entered a short trade on the previous level breakdown and will re-enter with lower risk on this one.
📉 Long Position Trigger
there is no buy trigger yet. Even if VET pumps 20% suddenly, I won’t regret missing it because momentum will bring better opportunities for long entries later.
📝 Final Thoughts
Stay calm, trade wisely, and let's capture the market's best opportunities!
This analysis reflects our opinions and is not financial advice.
Share your thoughts in the comments, and don’t forget to share this analysis with your friends! ❤️

#VETUSDT_DAccording to the specified movement , I Expect the formation of a Triangle pattern in the corrective wave (WXY) .

VeChain (VET): Incoming Drop, Be Careful As We Might Fall Hard!VeChain has shown great dominance of sellers since last time we looked at the coin (month ago).
Ever since sellers took control over the resistance zone and re-tested it multiple times, we are now expecting to see a further movement to lower zones.
We are waiting for the price to bounce in between the resistance zone and that smaller bullish trend where the price is sitting currently, and at one moment we expect the sellers to break it, which would lead to the movement to lower zones then!
Swallow Team

$VET Ready to Breakout?NYSE:VET
VET is forming a symmetrical triangle pattern, with price consolidating near key support and the blue MA.
A breakout above the resistance trendline could trigger a strong move, while a breakdown may lead to invalidation.
Accumulation Zone: 0.04317 - 0.04412
SL/Invalidation: 0.03778
DYO, NFA.

VET Trading RangeVET has some rectangle range maybe reaccumulation or redistribution zone
buy some at 42-44 is good option and jackpot if this is wyckoff accumulation

VETUSDT analysis and prediction 2025 #VeChain #VET #Crypto #Bloc**VeChain (VET) Fundamental Analysis for 2025**
#VeChain #VET #Crypto #Blockchain #VETUSDT #CryptoAnalysis #CryptoPrediction #Altcoins #Cryptocurrency #DeFi #NFT #SupplyChain #VeChainThor #VTHO #CryptoInvesting #TechnicalAnalysis #FundamentalAnalysis #Bullish #Bearish #CryptoMarket
#### **1. Project Overview**
VeChain is a blockchain platform focused on supply chain management and business processes. It provides real-world utility by helping companies track and verify products through decentralized technology. Major partnerships include Walmart China, BMW, PwC, and DNV GL.
#### **2. Market Position & Use Cases**
- **Supply Chain Management:** Used in industries like food safety, luxury goods, and healthcare.
- **NFTs & DeFi:** Expanding beyond logistics into decentralized applications.
- **Corporate Adoption:** Strong enterprise partnerships enhance its real-world demand.
#### **3. Tokenomics**
- **VET (Main Token):** Used for transactions and value transfers.
- **VTHO (Gas Token):** Used for transaction fees, generated by holding VET.
- **Staking Mechanism:** Investors earn passive income through staking rewards.
#### **4. Strengths & Opportunities**
✅ **Strong Enterprise Adoption:** Companies actively use VeChain for real-world applications.
✅ **Low Fees & Scalability:** Efficient transaction processing with minimal costs.
✅ **Government & Regulatory Support:** Recognized for compliance and sustainable blockchain solutions.
✅ **Growing Ecosystem:** Expansion into DeFi, NFTs, and carbon tracking.
#### **5. Risks & Challenges**
❌ **Dependence on Partnerships:** Success relies on corporate adoption.
❌ **Competition:** Rivals like IBM Blockchain and Chainlink pose threats.
❌ **Market Volatility:** Crypto downturns impact VET's price significantly.
#### **6. 2025 Prediction Summary**
- If adoption continues, **VET could reach $0.07–$0.10**.
- A bull market could push it higher, but a bearish trend may see **VET around $0.035–$0.05**.
- Long-term potential depends on continued enterprise adoption and blockchain growth.

VeChain: Rise from Channel Bottom to Top or a Big Breakout?💠 Technical Analysis:
VeChain has been consolidating within a price channel and recently found support at the channel bottom. It has also broken its downtrend line and a key static resistance level, now pulling back to this zone.
📊 Buy Signal:
🎯 Targets:
🔹 First Target: Channel top
🔹 Second Target: If the channel breaks, a move equal to its width
📢 What’s your opinion on this analysis? Drop a comment! 🚀🔥

Does history repeat itself?hello guys
We came with the analysis of this coin.
According to the past of the chart and the price correction and the period of time the price has been suffering, we can give the probability that the history will repeat itself.
we will see...
*Trade safely with us*

#VET/USDT lONG Ready to go higher#VET
The price is moving in a descending channel on the 1-hour frame and sticking to it well
We have a bounce from the lower limit of the descending channel, this support is at 0.04570
We have a downtrend on the RSI indicator that is about to break, which supports the rise
We have a trend to stabilize above the moving average 100
Entry price 0.04670
First target 0.04860
Second target 0.05180
Third target 0.05546

#VET/USDT #VET
The price is moving in a descending channel on the 1-hour frame and is expected to continue upwards
We have a trend to stabilize above the moving average 100 again
We have a descending trend on the RSI indicator that supports the rise by breaking it upwards
We have a support area at the lower limit of the channel at a price of 0.04111
Entry price 0.04407
First target 0.04640
Second target 0.04860
Third target 0.05090

VET waiting my targetsBINANCE:VETUSDT
Possible Targets and explanation idea
➡️Vet weekly timeframe still waiting signal close short on weekly and buy based on TradeON
➡️I think we will see drop to 0.27 zone again sweep liquidity and close monthly gaps
➡️0.009-0.007 more likely will be a bottom for Vechain
➡️Positive bounce its a 0.039 monthly gap around 0 lvl
➡️Even after this bounce I think we will see continuation to low targets
Hope you enjoyed the content I created, You can support with your likes and comments this idea so more people can watch!
✅Disclaimer: Please be aware of the risks involved in trading. This idea was made for educational purposes only not for financial Investment Purposes.
---
• Look at my ideas about interesting altcoins in the related section down below ↓
• For more ideas please hit "Like" and "Follow"!

VET is wet ...1 h time frame setup for VET usdt pair
previous setup on nobody candle hit the target as well
and now here we go for second setup
what will be happen do you think?

VETUSDT Wave AnalysisHello Friendes. According the chart of VETUSDT I expected to this movement and 0.105$ . This Way possible by cottrction but see that price.