VET USDTGuys this one is the right one and all the other charts will do the same , gotta check once we get to AR target and dropped there is two different models of this but we will know once we reach AR , will update if you guts interested.
VETUSDT trade ideas

VET usdtDon't know if you guys are aware of Wyckoff Events and Phases but this looks really good. Not too late to get in.

vetusdtTaking this trade , good risk reward. This isn't for sure so might loose but btc looks it bottom for now and do an ABC which after we will get the massive drop. Might give time for vet to reach the target, good luck and trade at your own risk.

VETUSDT ASCENDING TRIANGLEVET has been ranging from the s/r levels by following a neutral ascending pattern and its currently at the verge of breaking out of the Resistance Level $0.0462 with the formation of a bullish double bottom pattern on 4hr timeframe. Wait for breakout at the Resistance Level $0.0462 to see if the current support would hold. A 4hr close above the level should prone an attempt to take a long position after it retests.
Your likes and opinions would be much appreciated, you can follow up for more helpful contents and do follow my comment sections too for quick updates.

VET, 4h level uptrend, buy planVET, 4h level operation:
Direction: Buy & Go Long
Good entry price: under 0.059
Stop loss price: below 0.057
Take Profit Price: 0.0638

vet usdt I just bought a bunch of vet , btc is gonna dump further but vet will lead the market in the comings days.

VETUSDT - Possible higher lowHi,
This is iJustCoin, the one lucky trader who puts his money where his mouth is!
I've closed my short trade on VET from my previous idea. Now i got a LONG signal from the 6H timeframe
Here is the trade:
SL: $0.05577/ 3.5%
Entry: $0.05772
Entry2: $0.05838
Take Profit 1: $0.6218/ 6.5%
Take Profit 2: $0.6142 / 7.8%
Estimate trade duration: 4 days
Estimate time to close the trade: 25 April - 27 April
======
Click like and make sure you are following me on TradingView!
Feel free to ask me any questions related to the idea in the comment section - i'll be glad to reply.
=====
Bye-bye!
Good Luck!
***
Chart Code:
Pastel Green Vertical Line - Long Signal (iJustCoin Phoenix Reader Strategy)
Pastel Red Vertical Line - Short Signal (iJustCoin Phoenix Reader Strategy)
Red Dashed Lines - Downward Reversal Momentum
Green Dashed Lines - Upward Reversal Momentum
Green Rectangle - Buying Area
Red Rectangle - Selling Area
Red Line - Stop Loss
Bold Aqua Dotted Line - Estimate Price Direction
Yellow Dotted Lines - Estimate Timerange of the price target might be getting hit
Orange Dotted Line - Profit taking Point
***


VECHAIN - WHAT'S UP?BINANCE:VETUSDT
Despite the bleeding of BTC and US indices, VET looks like it's getting ready for one more pump. I love the project and I hold a large position in it, long term it will succeed but short term we may be looking at better buy opportunities. In case of a bear market, many investors will move away from risk on altcoins and the small caps won't survive a 50% BTC drop. I hope VeChain will.
In addition to that we can also see some established price action building up on BINANCE:VETBTC
Have a blessed day.


VETUSD (4H) Bullish reversalHi Traders
VETUSD (4H Timeframe)
Waiting for the upward break of 0.0640 resistance level, which will complete a bullish trend reversal pattern to go LONG. Only the downward break of 0.0550 would cancel the bullish scenario.
Trade details
Entry: 0.0640
Stop loss: 0.0550
Take profit 1: 0.0695
Take profit 2: 0.0785
Score: 6
Strategy: Bullish reversal

VETUSDT - Scalping short tradeHi,
This is iJustCoin, the one lucky trader who puts his money where his mouth is!
Well, i updated my trading strategy and i am excited to provide a signal.
My indicator gave me the signal to short and it looks like a promising trade!
You may notice that my SL is INCREDIBLY huge and you may think "boy,this trade won't make me a millionare and there is not point to trade that".
Well i'd think that too. But i wanted to make trading more relaxed and comfortable so i could be enjoying my life taking profits instead of getting bamboozled each time price hits my tight SL.
So that kind of SL is a part of my trading strategy upgrade. Hope it will bring you joy as well.
Anyway here is the trade:
SL: $0.06405 / 5.30%
Entry 1: $0.06082
Entry 2: $0.06186
Take Profit 1: $0.05749/ 5%
Take Profit 2: $0.05620 / 7%
Estimate trade duration: 12-30 hours
If you didn't click Like - you should do that right now.
Feel free to ask me any questions related to the idea in the comment section - i'll be glad to reply.
And make sure YOU ARE FOLLOWING ME!
Bye-bye!
Good Luck!
***
Chart Code:
Pastel Green Vertical Line - iJustCoin Phoenix Reader Strategy Long Signal
Pastel Red Vertical Line - iJustCoin Phoenix Reader Strategy Short Signal
Red Dashed Lines - Downward Reversal Momentum
Green Dashed Lines - Upward Reversal Momentum
Green Rectangle - Buying Area
Red Rectangle - Selling Area
Red Line - Stop Loss
Bold Aqua Dotted Line - Estimate Price Direction
Yellow Dotted Lines - Estimate Timerange of the price target might be getting hit
Orange Dotted Line - Profit taking Point
***

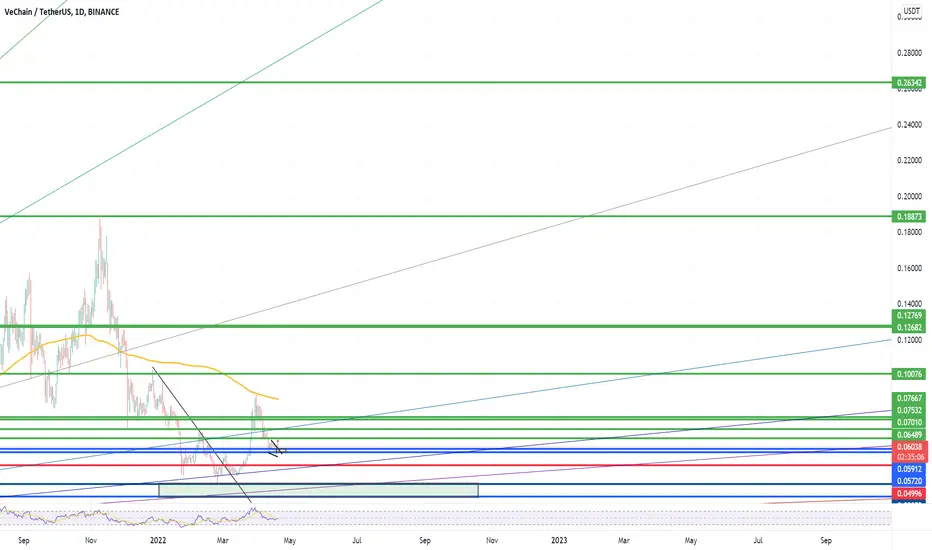
vechain /tetherusHello everyone, according to my graphic analysis of the chart VeChain,
We have a high probability to buy if the bull flag is broken

#VET on my ultimate 10 coin of investment list IMO
there are 2 areas to start buying vechain
the 1st one :
the area between
0.057-0.059
the 2nd area:
between
0.032-.039
invalidation of this setup would be weekly violation of
0.030
that's around -40 %
so as usual do your own research and manage your risks
and definitely not a financial advise
the targets will be in green
0.1
0.12
0.18
0.26
0.35
0.45
VETUSDTIt has divergence and breaks out the trendline in both Rsi and chart! It will be a good situation to long in pullback.

VETUSD - It may be the end of an impulse wave.At this point we can expect a nice bounce.
But the point to remember is that the downtrend may not be over yet.


VETSalaam
Despite VET return backed to the channel and we saw powerful bearish candle 2 days ago, it stopped at key level 0.057 and yesterday's candle closed as beautiful bullish pinbar that coincide with 61 FIBO of last swing 0.044-0.087.
The key levels are the most important of analysis compared with trend lines and channels because trend lines are subjective and not absolute.
We see same scenario in BTC and ETH.
Let's see if VET could break the channel's resistance at 0.062 and close a daily candle above it or not.
The next resistance is 0.07.
Manage your risk!
Good luck,

VECHAIN - Breakout Coming 🚨Vechain has completed the higher timeframe ABC correction and now we simply need to look for bullish corrections to enter.
We currently have a really nice bull flag with a solid trendline which we can monitor for a break. It's possible that we may revisit the double bottom before moving up so just bare that in mind and have it marked out on your charts incase we do get that scenario.
Trade Idea:
- Enter on breakout of corrective bullflag (red trendline)
- Stops below the correction
- Targets: 0.17, 0.28, 0.35, 0.45
Let us know your thoughts below.
Goodluck and trade safe!

VET WeeklyVET is one of the strongest projects in the realm of "the internet of things" aka IoT.
These levels are where I'm gonna invest. If BTC reaches 30K again, these buy levels will be touched, hopefully! :)

vet usd in buy situationhello to guys
vetusdt i think in a buy situation because we have a harmonic pattern and rsi is below 30 percent this mean may we have a short long
therefor wait and see or make a trade as own risk

Vet/usdt in the making of wave5vet/usdt is currently in the making of wave5 of expanding diagonal pattern which must be longer than wave 3.

A couple of different options for VET to take next week.I think both these options could easily play out, option 1 would take our 4th wave higher before we move down in our 5th. (if option 1 plays out then we would Need to adjust our lower end targets for wave 5.
Option 2 we go straight down to target levels to complete wave 5 and move on ups from there.
Option 3 would be that we just blast off to the moon and all my counts are wrong.
