VETUSDT trade ideas

Potential long VETUSDTTop down analysis:
W: Looking at the weekly we see VET touched a strong support zone and rebounded nicely. Yet we are still in a long-term downtrend on VET so enter trade with caution. (red lines)
D: Zooming in on the daily we can see VET had some consolidation near the support zone and broke out of the channel. When drawing a FIB retracement on the previous leg up we can see that there is confluence between the support zone and the 0.236 level.
H1: This brings me to this trade. Right now on the 1H, we can see a double bottom forming right on the above-mentioned support zone and FIB level.
Entry:
I would first like to either see a new range of consolidation forming and tracking it for a break-out. if this does not happen I will be looking at forming HL & HH. I will update this post when the time comes.
If you appreciate my analysis a like or follow would mean the world to me.

VETSalaam
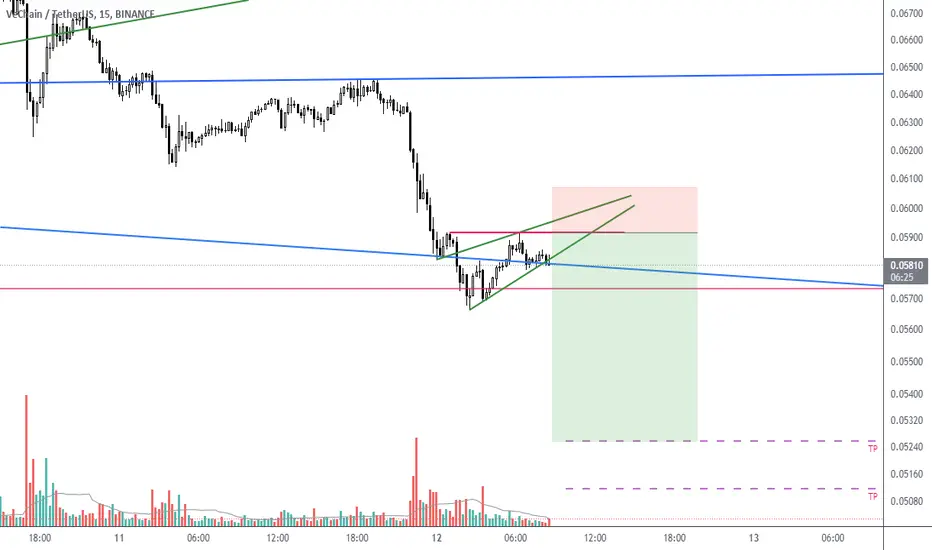
After falling last day, it doesn't seem any rejection and bouncing!
VET going to make a rising wedge in 15m.
break it and could go down about 10% from here!
I'm still waiting for a good buying opportunity.
Do your analysis first before entering any trade.
Because you need efficient confidence to hold a trade and give good decisions.
Good luck!

VET will give us 35% soonfollow us to get best profit of the market.💎🔥
VET will give us 35% profit soon.🤩😇

VETUSDT_Daily_2.11.22The photo says it all, please check and give your opinion.....
👤Mohamadhjz : @Mohamadhjz
📅11.Feb.22
⚠️(DYOR)
❤️ If you apperciate my work , Please like and comment , It Keeps me motivated to do better friend, I hope you are well

VET: Cup and HandleVET/USD (4Hour)
Bullish case:
- Has found previous support and broke through resistance lines.
- Cup and Handle looks to be in play with it possibly hitting old support which should serve as resistance at the $0.08 range
- Golden Cross looking to form in the upcoming candles
Bearish Case:
- Could get rejected at the peak of the handle at $0.07.
Thoughts?

VeChain Weekly ChartVet Weekly Chart
Vet Chain is , as most of Crypto coins are, trending down since the ATH April 2021.
The last two weeks the price bounced off the major S/R around the 0.050 area, and is approaching another resistance at 0.06750
To make it to 0.075 (also 78.6% Fibo Ret of the last swing from 0.18755)
Vet price need to stay consistently above 0.06750.
Weekly trend reversal will be in place above 0.1000 and by the time would be nice to breakout the diagonal trendline
0.10 is also a 61.8% Fibo Ret of the last swing down from 0.18755
Below 0.050 the next stop may be the 0.040 area , with the nightmare scenario as to go to 0.030.
My focus will be on any candles pattern to confirm the 0.06750 support.
Also, at H4 Timeframe MA200 is now support.
This is only my personal view, Not Financial Advice here.

VECHAIN , Falling Wedge ✅All supports and resistances are marked on the chart. As we can see, the price is in an important range and recommended to keep an eye on it ...
Follow our other analysis & Feel free to ask any questions you have, we are here to help .
⚠️ This Analysis will be updated ...
📊 #VETUSDT ( Vechain )
💹 Time Frame : Weekly
👤 Saeid.Mahbob
📅 10.Feb.22
❤️ If you apperciate my work , Please like and comment , It Keeps me motivated to do better ❤️

VETUSDTSHORT
VETUSDT
ENTRY : 0.06560-0.06666
Targets : 0.06449-0.06374-0.06290-0.06215-0.06140-0.06053-0.05984-0.05906-0.05833
Stop Loss : 0.06816
Leverage: Cross 50x
-

$Vet Long If price rejects to .0646 I will watch how buyers react to this level.
This is an important level where buyers are stacked up.
If price sells through this area = No trade
If price continues to rally = No trade
Confluence
200EMA>
50Ema>
VWAP test
Support
Demand zone
Potential bear trap
Pivot point (daily)
POC

Insane VeChain Bull Flag in Formation!Hey Traders,
This may be my most important trade yet! According to the Weekly chart of VETUSD, the price action has formed a bull flag (attached image URL). The breakout target out of this pattern is approximately 1.1-1.2 USD. In the rare case this does break down the target would be 0.007 USD (In this case we could open a short).
VeChain (VET) is a very revolutionary blockchain product, its utility is very unique compared to other Cryptocurrency Projects. The various amounts of things VeChain could be used to track for supply are infinite, not to mention it could also partner up with things like oracles AKA Chainlink to make it more efficient and data rich.
I hope this helped,
-Pulkanator

VETUSDT, LONG, 1D, BOUNCING FROM STRONG BOTTOM SUPPORT!!VETUSDT is bouncing back from strong support zone, my TP 1 will be at 0.07746 which is 0.236 Fib & previous support too.
And if the momentum continues my TP 2 will be 0.09844 which is at 0.382 Fib.
Good Luck ;)

VETUSDT TECHNICAL ANALYSISThe candles break out down trendline and one candle open-close above to down trendline. Also, MA changed to direction as well. Not only that, we have received multiple buy signals from @EngineeringRobo as well and Candle is staying above to support line as well. If market not get any correction in short time, we may earn approximately 46%. Let's follow our analysis together and do not forget the follow me.
"NFA"

VET USDT downside target under $0.064-HTF confluence with fibs, speed fibs, high volume node, range anchored vwap, and 55 vwma.

VETSalaam
All healthy markets need some correction after a decent rally.
VET retrace 60 Fibo of last up move.
Also, there are falling flag (channel) in 15m charts of many coins that could be a good sign to show the correction will end soon.
But remember that no pattern is perfect and always consider some percent to fail patterns.
So, manage the risk and use stop loss to control it.
Good luck
