SPOT VET LONG 15.12.2024🎯Purpose:
0.07642
‼️Risk per trade: 0.5% of the allocated funds for spot trading.
VETUSDT trade ideas

Golden Opportunity for VET; Ready for Big Targets!If you're looking for a strong upward move in the crypto market, VET has reached an exciting and critical point. It seems that the B wave correction has finished, and now it's entering the C wave. It's about to face the 9 cent resistance, and if this level breaks, it could trigger a powerful rally!
🎯 Targets:
1️⃣ $0.60 (560% profit)
2️⃣ $1.50 (1550% profit)
This opportunity could bring significant gains for those who have been waiting for the right moment. Always enter with precise analysis and proper risk management.
Important note: Once 9 cents breaks, be ready to enter, but also stay cautious of any potential corrections!
With careful attention, you can take advantage of this move. Stay successful! 💪

VETLet's what happens. entry can be updated if too bullish in the coming days.
I am an amateur trader. I sometimes enter into trades. Other times it is only an analysis. Trade with your own risk awareness.

Buying Here Providing High R/R👉 The Price Perfectly Bounced From a Trend Line And The Main PRZ For Wave C, Expect a Bullish Move From Here Toward a Top Of The Bull Flag And Breakout To The 0.0757$ And 0.092$

VeChain | Massive Upside PotentialVET Previous Analyzes
Now I think another opportunity is coming.
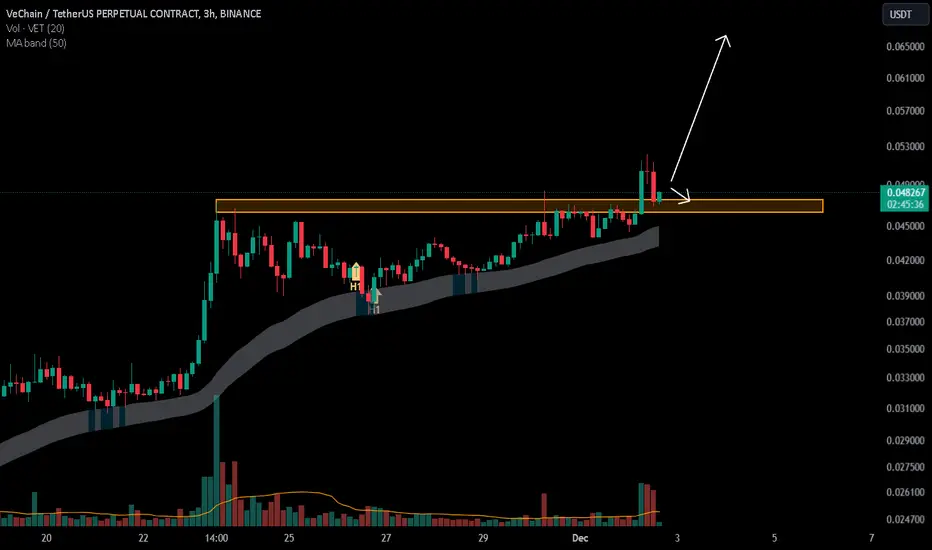
1. Importance of the Red Box Resistance
Key Level Confirmation: If this resistance is broken with strong momentum and volume, it likely signals that VET has overcome a critical supply zone. This often serves as a launchpad for further upside.
Psychological Shift: Breaking a notable resistance can attract new buyers and trigger short covering, accelerating upward movement.
2. Entry Point and Positioning
Previous Recommendation at $0.045: Your call around $0.045 was a solid entry point in hindsight. Those who followed it are now in a position of strength.
Re-Entry Strategy: For those looking to "upload" again, targeting a pullback to support zones post-breakout (if the red box is cleared) can be an effective strategy. Use Fibonacci retracement levels or prior consolidation zones for precision.
3. Bullish Scenario Validation
Volume Confirmation: A breakout above the red box should be accompanied by significant volume to confirm the move isn't a false breakout.
Macro Factors for VET: Consider VeChain's fundamentals, such as partnerships, enterprise adoption, and developments in blockchain supply chain solutions. Positive news can fuel the rally further.
4. Long-Term Vision for VET
Next Resistance Levels: Identify key targets for profit-taking or psychological resistance zones (e.g., $0.10).
Spot Holdings Strategy: For long-term holders, accumulating in green zones while focusing on the macro bullish narrative of VET is a sound approach.
I keep my charts clean and simple because I believe clarity leads to better decisions.
My approach is built on years of experience and a solid track record. I don’t claim to know it all, but I’m confident in my ability to spot high-probability setups.
My Previous Analysis
🐶 DOGEUSDT.P: Next Move
🎨 RENDERUSDT.P: Opportunity of the Month
💎 ETHUSDT.P: Where to Retrace
🟢 BNBUSDT.P: Potential Surge
📊 BTC Dominance: Reaction Zone
🌊 WAVESUSDT.P: Demand Zone Potential
🟣 UNIUSDT.P: Long-Term Trade
🔵 XRPUSDT.P: Entry Zones
🔗 LINKUSDT.P: Follow The River
📈 BTCUSDT.P: Two Key Demand Zones
🟩 POLUSDT: Bullish Momentum
🌟 PENDLEUSDT: Where Opportunity Meets Precision
🔥 BTCUSDT.P: Liquidation of Highly Leveraged Longs
🌊 SOLUSDT.P: SOL's Dip - Your Opportunity
🐸 1000PEPEUSDT.P: Prime Bounce Zone Unlocked
🚀 ETHUSDT.P: Set to Explode - Don't Miss This Game Changer
🤖 IQUSDT: Smart Plan
⚡️ PONDUSDT: A Trade Not Taken Is Better Than a Losing One

VET / USDT: rebounding towards trendline resistance VET/USDT: Rebounding Toward Trendline Resistance – Breakout Ahead?
VET/USDT is showing promising signs 📈 as it rebounds from a strong support level, making its way toward a critical trendline resistance 📊. This setup hints at a potential breakout 💥 that could pave the way for a bullish move 🚀. Stay alert for confirmation signals before taking action 👀.
Key Insights:
1. Support Bounce: VET/USDT has found solid support, fueling bullish momentum as it approaches trendline resistance.
2. Volume Watch: A surge in trading volume during a breakout will confirm buyer strength 🔥.
3. Momentum Build-Up: RSI and MACD indicators are trending upward ⚡, signaling increasing bullish pressure.
Steps to Confirm the Breakout:
Wait for a 4H or daily candle to close decisively above the trendline 📍.
Monitor for a significant volume spike during the breakout, indicating robust buying activity 📊.
A retest of the trendline as a new support will validate the breakout ✅.
Be cautious of false breakouts, such as sharp reversals or wicks above resistance ⚠️.
Risk Management Strategies:
Place stop-loss orders below the breakout zone or key support to manage risk effectively 🔒.
Ensure position sizing aligns with your trading plan 🎯.
This analysis is for educational purposes only and not financial advice. Conduct your own research (DYOR) 🔍 before making investment decisions.

XRP Momentum BREAKOUT! / Indicator Shows 3 Year HIGH on XRPHigh Followers. I like to keep things simple.
We needed this pullback as XRP has risen over 400% this year alone.
Although, checkout the momentum indicator as there is a clear breakout marking a 3 year high. Things are going to get very rocky with XRP any day now. I would not engage in day trading this asset.
I am long term bullish on XRP with an anticipated growth to $18-$22.

VETUSDT ---->Buy positionVETUSDT BUY position
first target 0.055 $
main long term target 0.19 (450 % profit)
don't forget money management
be profitable

Ve Chain (VET): Possible Re-Test of Broken Resistance ZoneVechain has made a good breakout on the daily timeframe, resulting in a big gap just above the broken resistance zone.
We are now looking for this zone to be re-tested and secured by buyers in order to see further movement to upper zones, which means we are looking for a slight downward movement before a bullish run on VET coin!
Swallow Team

VeChain Price Analysis: Targeting $0.22 in a 32-Day CycleThis is my analysis of VeChain's price chart. I believe it will behave similarly to its performance in 2021. Over a 32-day period, I anticipate the price will rise to $0.22.
Additional Notes and Suggestions:
1. Historical Patterns:
Comparing the current price action to 2021 is a reasonable approach if there are clear similarities in volume, sentiment, and market conditions. However, ensure you evaluate the broader crypto market trends in 2024 compared to 2021 to validate this comparison.
2. Fibonacci Levels:
The chart shows strong resistance near the $0.18-$0.22 levels (Fibonacci 1.0-1.618). Monitor how price reacts to these levels, as they could either confirm the bullish breakout or signal a reversal.
The 0.786 ($0.14405) and 0.618 ($0.11635) retracement levels could act as key support zones in case of a pullback.
3. Volume and Momentum:
Look for increasing trading volume and strong bullish momentum to support your prediction. A divergence between price and volume could indicate weakening trends.
4. Risk Management:
If trading, set stop-loss levels to manage potential losses. Price could consolidate or retrace sharply, particularly if broader market conditions shift.
5. Market News:
Stay updated with any VeChain-specific announcements or partnerships. Positive news can act as a catalyst to accelerate price movement towards your target.

SPOT VET LONG 3.12.2024🎯Purpose:
0.13522
‼️We enter at 0.5% of the allocated money for spot trading.

Here I buy Vechain at $0.055Here I buy Vechain at $0.055 cents
sell orders all getting filled with market orders
And now I'm triggering the major Vechain supply shock baby
crypto meg on the loose
Take it or find an excuse
I'm on the highway to moon
no stop signs
no speed limit
nobody's gonna slow me down
nobody's gonna mess me around
cause I am in COMMAND
hey sardines look at me
I'm on my way to the promised LAAAAND

Vechain next stop .40XRP profits going to start trickling down into smaller coins... eyes on vet, vra, tel...

#VET/USDT Ready to go up#VET
The price is moving in a descending channel on the 1-hour frame and sticking to it well
We have a bounce from the lower limit of the descending channel, this support is at 0.03870
We have a downtrend on the RSI indicator that is about to break, which supports the rise
We have a trend to stabilize above the moving average 100
Entry price 0.04200
First target 0.04416
Second target 0.04597
Third target 0.04209

VETUSDTHMT v1.0 spotted. Looking good with previous wave up with increasing volume and momentum.
- BOS (Breaks of Structure) at @ 0.04716 - 0.04852 level
- Trending slow and steady if able to hold above the BOS level
It is at extremely good reward to risk level.
Will Vet activate its bullish structures?With a new higher high Vet could open up the way to an even further breakout. Thrilled to see how this develops. My tradeplan is highlighted for you guys :) Will add to position upon every consolidation/ Box Retracement

The Sleeping Giant Awakens!We have a huge volume spike on VET
Even though there are good demand areas below, you must have a plan in case it rises without visiting those places.
However, all 3 zones are ideal for the rise and the total includes a maximum of 20% retracement.
This is also acceptable for spot. You can also evaluate the regions as separate trades in futures.
📌 Follow me for more game-changing setups, expert insights, and strategies that work! 🚀
I don't overcomplicate things and add a ton of dirty crap to my charts, but you can check out the success of my analysis below.
I approach trading with confidence backed by experience and past success in identifying high-probability setups.
While I don’t claim to be the best, my track record speaks for itself, and I strive to let my analysis and results do the talking. Watch these levels closely—markets can confirm what charts already whisper. Let’s see how this plays out together.
My Previous Hits
🐶 DOGEUSDT.P | 4 Reward for 1 Risk (or more if you’re bold).
DOGEUSDT.P: Next Move
🎨 RENDERUSDT.P | HTF Sniper Precision
RENDERUSDT.P: Opportunity of the Month
💎 ETHUSDT.P | Buyer Zone So Accurate You’ll Double Check
ETHUSDT.P: Where to Retrace
🟢 BNBUSDT.P | Buyer Zone Mastery (CZ vibes).
BNBUSDT.P: Potential Surge
📊 Bitcoin Dominance | Called it Like a Pro
BTC Dominance: Reaction Zone
🌊 WAVESUSDT.P | The Blue Box: A Demand Zone with Potential
WAVESUSDT.P: Demand Zone Potential
🟣 UNIUSDT.P | Long-Term Trade
UNIUSDT.P: Long-Term Trade
Now sit back, relax, and watch the market do its thing. Or don’t, FOMO is real. 😉

$VET or $VECHAIN Bullish- Possible bullish pullback price movement towards the resistance 0.90$ within the next period. That's 150% up

VETUSD- Vechain going to 1.5 USD (Min Target 1.02)- By Jan 2026The cryptogem, real world asset VETUSD- Vechain going to 1.5 USD (Min Target 1.02) by Jan 2026 as per logarithimic analysis

VeChain (VET) - Key Levels 2024VeChain has yet to push price action above the neckline in order to have a continuation to the upside. Breaking the neckline will result in VET reaching a target of Resistance at: "$0.08" with up to +60%.
Candle wick rejection has formed again on the weekly time frame at the levels between the following: $0.047 - $0.054. A pullback to these levels will likely hold strong support around "$0.034" and bulls will retest major Resistance at "$0.04" once again in the future!


VeChain Pre-2025 Bull-Market Accumulation Zone & StrategyVeChain is a winner for us. We've traded this pair many times in the past with success and that's great. Very simple indeed, buy and hold and that's it. No margin, no leverage; no risk.
➢ Technical Analysis
The 2023/24 bullish wave was great but nothing really in comparison to the awesome bull-market we experienced all throughout 2021. The great news? The 2023/24 bullish wave is only the start, the beginning; the appetizer.
If you look at the left side of this chart, you can see something similar. Before the major bull-run in 2021 there was a bullish wave similar to what we experienced recently. There are two waves: The first one when the whales buy-in with force, and the second one is the full-blown bull-market where everybody participates. Whales and retail.
2025 Is the bull-market year and VeChain (VETUSDT) is on the list for strong bullish action, based on this chart.
A new all-time high, based on the proven theory that long-term higher lows lead to long-term higher highs, and the fact that each new bull-market ends in a bull-run that produces new ATHs, VeChain can reach as high as $0.73, or 33X from current price. Even if no new ATH is hit, growth potential ranges between 12-18X. Pretty good by any and all standards.
Even now, in 2024, and even last year, 2023, we had many altcoins producing staggering numbers. This is something normal in this market because this is a new, young, volatile and evolving market. Just as there can be big wins there can also be huge losses. So make sure to choose strong pairs from reputable exchanges. Or if you hold your own coins, strong cryptocurrency projects. There are many amazing ones with new ones coming out all of the time.
The pre-bull market wave of 2020 led to a correction and later an accumulation phase that lasted about four months. The situation is pretty similar today. How long the accumulation phase lasts depends on when you start counting but it can be between 3-6 months. Four months if we count starting September 2024 and the bullish action starting January 2025. That's just an idea.
The accumulation zone range would be "buy everything" below 0.02400. With the potential of seeing prices going as log as 0.01300 or even 0.00900. It is a big range.
➢ Trading Tips
Get a hobby. Get some books. Join a club. Go to the gym. Start a walking routine, etc. These activities so that you never have to become attached to your electronic devices, to your screen.
One of the main mistakes aspiring and regular traders make is spending too much time in front of the screen. Set it and forget it. Buy and hold.
Remember, it is a waiting game; we have to wait for years with the exception being months.
While you wait, work on your health, your mind, personal growth. You need to be strong and healthy in order to be able to enjoy massive gains in the bull-market that is sure to come. Makes sense?
Start preparing now! A sound mind is needed for long-term success.
Strategy: Buy and hold.
I know you can do this my friend. We've been here before.
The market offers endless opportunities. You can win! I can win!
I am sure to win... It is easy because we have a do-able, safe and sound strategy. Don't you agree?
Write it down. Commit it to memory.
Plan with a friend. Your boyfriend or girlfriend. Do what you need.
Just make sure to be ready... I want you to be able to say, "Finally, I am able to succeed!"
Buy and hold... Patience is key!
Namaste.

VECHAIN BUYING- Possible bullish pullback price movement on CRYPTOCAP:XLM towards the resistance 0.68$ within the next period.
