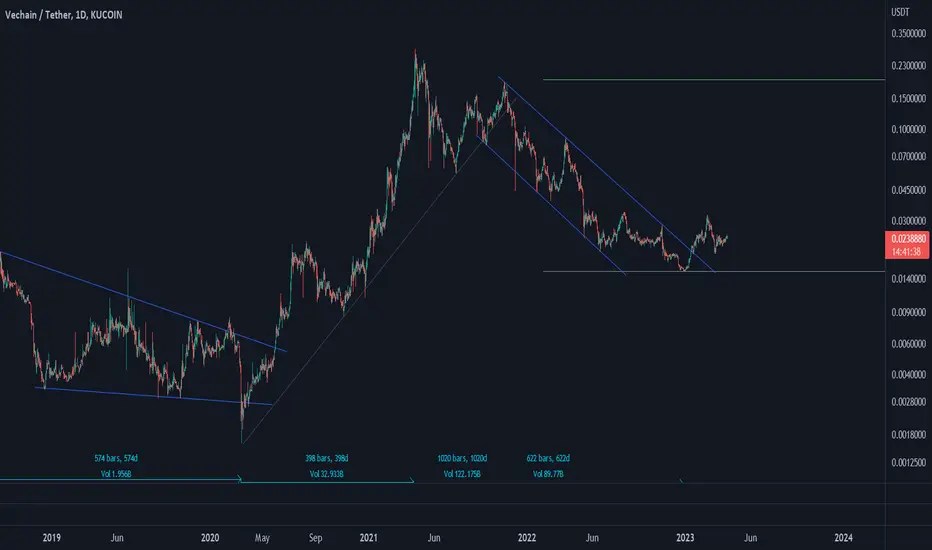
Vechain LongVechain looks amazing.
There is a clear shift in momentum with the consecutive higher lows, this one especially backtesting previous support. Clear as day, we are heavy in this one and will watch all levels above.
VETUSDT trade ideas

Vet Looks Ready For 300 to 400% Bullish Wave Like Doge Chart Looks Extremely Bullish For Vechain I Posted 1st Breakout Falling Wedge After That Vet Bounces Currently Vet Approaching Towards Symmetrical Triangle,s Major Resistance (Multi Year Descending Trendline) Expecting Successful Breakout In Coming Days From Here Vechain Easily Can Give 300-400% In Midterm

VETUSDT LongDon't do much active trading these days but crypto looks to be offering a great pullback opportunity.

#VET/USDT#VET
The price is moving within a bearish channel pattern on the 4-hour frame, which is a strong retracement pattern
We have a bounce from a major support area in green at 0.02200
We have a tendency to stabilize above the Moving Average 100
We have a downtrend on the RSI indicator that supports the rise and gives greater momentum, upon which the price is based higher at the discount
Entry price is 0.02312
The first target is 0.02750
The second target is 0.03070
The third goal is 0.03440

#VET/USDT#VET
The price is moving in a descending channel on the 1-hour frame and sticking to it well
We have a bounce from the lower limit of the descending channel and we are now touching this support at a price of 0.02200
We have a downtrend on the RSI indicator that is about to be broken, which supports the rise
We have a trend to stabilize above the moving average 100
Entry price 0.02430
First target 0.02300
Second target 0.02362
Third target 0.02425

VET - Target - $0,05 - Falling Wedge and Triple bottom break outVET looks ready for a strong movement up. On the daily timeframe you can see that the bullish falling wedge is completed and that VET is moving in a Triple bottom pattern. Both patterns indicates a bullish movement up. Target could be $0,05.

longSupport and press the rocket to cheer me up
Observe the ten percent loss limit
Stay away from Bitcoins
Feel free to buy and sell and post your comments

Vechain (VET)Vechain analysis is simple; an upward move followed by a corrective downward move which came down in a channel. Then the price broke the downtrend channel and it seems the next impulse wave has started. Let's see what happens.
#VET (SPOT- Investing ) entry ( 0.01960- 0.02260). SL (0.01890)BINANCE:VETUSDT
entry range ( 0.01960- 0.02260)
Target1 (0.03499) - Target2 (0.06860) - Target3 (0.10390) - Target4 (0.14790)
SL .1D close below (0.01890)
** This coin may take long time to achieve all targets **
*** collect the coin slowly in the entry range ***
*** No FOMO - No Rush , it is a long journey ***
**** #Manta ,#OMNI, #DYM, #AI, #IO, #XAI , #ACE #NFP #RAD #WLD #ORDI #BLUR #SUI #Voxel #AEVO #VITE #APE #RDNT #FLUX #NMR #VANRY #TRB #HBAR #DGB #XEC #ERN #ALT #IO #ACA #HIVE #ASTR #ARDR #PIXEL #LTO #AERGO #SCRT #ATA #HOOK #FLOW #KSM #HFT #MINA #DATA #SC #JOE #RDNT #IQ #CFX #BICO #CTSI #KMD #FXS #DEGO #FORTH # AST #PORTAL #CYBER #RIF #ENJ #ZIL #APT #GALA #STEEM #ONE #LINK #NTRN #COTI #RENDER #ICX #IMX #ALICE #PYR #PORTAL #GRT #GMT # IDEX #NEAR #ICP #ETH #QTUM #VET ***

#VET/USDT#VET
The price is moving in a descending channel on the 1-hour frame upwards and is expected to continue
We have a trend to stabilize above the moving average 100 again
We have a downtrend on the RSI indicator that supports the rise by breaking it upwards
We have a support area at the lower limit of the channel at a price of 0.02070
Entry price 0.02110
First target 0.02156
Second target 0.02212
Third target 0.02275

VETUSDTVET ~ 4D
#VET If you still have Conviction on this coin,. Wait for this descending pattern to be successfully broken out and start buying gradually afterward. Target 20%++

#VET/USDT#VET
The price is moving in a descending channel on the 1-hour frame
And it is sticking to it well
We have a bounce from the lower limit of the ascending channel and we are now touching this support at a price of 0.02250
We have a downtrend on the RSI indicator that is about to be broken, which supports the rise
We have a trend to stabilize above the moving average 100
Entry price 0.02277
First target 0.02330
Second target 0.02400
Third target 0.02457

VETUSDT Long Setup Setting / Divergence on the ChartBINANCE:VETUSDT
COINBASE:VETUSD
📈Which side you pick?
Bull or Bear
SL1 ---> Low-risk status: 3x-4x Leverage
SL2 ---> Mid-risk status: 5x-8x Leverage
(If there is just one SL on the chart, I suggest, low risk status🙂
👾Note: The setup is active but expect the uncertain phase as well.
➡️Entry Area:
0.2295-0.2352
⚡️TP:
0.2360
0.2405
0.2440
0.2481
🔴SL:
0.2203
🧐The Alternate scenario:
If the price stabilize against the direction of the position, below or above the trigger zone, the setup will be canceled.

VET USDT- MUST WATCH THIS ANALYSISIf the price breaks the parallel channel and support, then the price can dump further, If price bounces from the support zone, then price can go up to above mid level of the parallel channel

VET USDT- MUST WATCH THIS ANALYSIS! If price rejects from the resistance zone, Then we can watch the below support zone

plenty of resistance, key support though..looking how things are right now we are right back at that level of support again.
this could swing either way, and there is plenty of volume above us still pushing down..
short term, I think a bit more downside, then reassess.
Let's see

#VET TRENDLINE BREAK#VET broke out of the downward trendline and made a HH after touching our weekly support.
There's a possibility that we might touch down on weekly support once more before the next move up.
Looks like a reversal is coming!

VETUSDT IdeaTDLR; this is a wave pattern and is expected to close last wave from here, otherwise is a void.

trend vet usdt#vetusdt
Uptrend is broken
Moving towards 0.0245 and if this support is broken, 0.0230 is the next downside target.

VETUSDT 1:1 Long Setup SettingBINANCE:VETUSDT
COINBASE:VETUSD
SL1 ---> Low-risk status: 3x-4x Leverage
SL2 ---> Mid-risk status: 5x-8x Leverage
👾The setup is active but expect the uncertain phase as well.
➡️Entry Area:
Yellow zone
⚡️TP:
0.02525
0.02551
0.02581
0.02621
🔴SL:
0.02354
🧐The Alternate scenario:
If the price stabilizes below the trigger zone, the setup will be cancelled.

VET - Long idea - Order Block concept testingVET - Long idea - Order Block concept testing
Just testing the SMC Order Block concept - please comment and lets learn together/

VETUSDTVET ~ 1D ✅
In 1D Time Frame,. #VET Moves in this descending pattern. The best way for now. Make purchases gradually after successfully breaking through the resistance line of this descending pattern.

VETUSDT looks bullishVETUSDT looks bullish on daily chart.
expecting breakout iin couple days. you can also buy when breakout for confirmation
