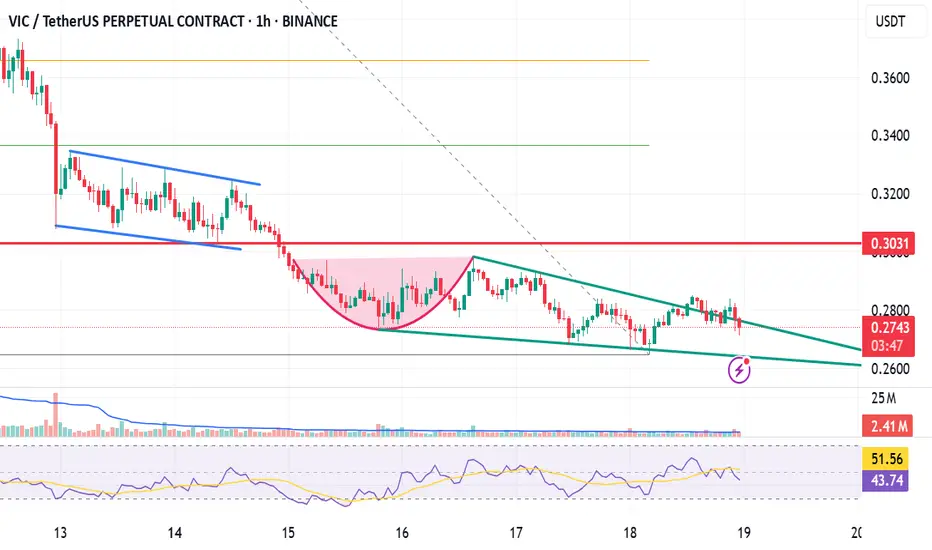
Vicusdt buy opportunityVICUSDT broke out of a falling wedge but encountered strong resistance at the supply zone, leading to a pullback for a potential retest of the wedge structure. The plan is to re-accumulate within the highlighted zone and monitor price action as it progresses toward the outlined targets on the chart.
VICUSDT trade ideas

vicusdt falling wedge trying to breakoutvicusdt (previously known as tomochain), currently is doing falling wedge pattern trying to breakout.
initially trying do a round bottom to breakout but eventually failed, and currently formed falling wedge to do reversal and change the behavior.
Viction Hits Bottom, 1,228% Growth Potential or HigherViction produced the highest volume ever on the 10-March week. All the other weeks have insignificant volume compared to this one and this session ended closing green. This is a strong signal.
A large part of the altcoins market produced a bottom 10-March.
Another signal that favors the bulls and the development of a bullish wave is the fact that bearish volume is very low as the market moves to produce lower lows. The final bottom happened last week and this week VICUSDT is full green.
There is a falling wedge pattern.
Seeing marketwide action and knowing the year is 2025 and we are already late for the bull market phase, we can be ready and should be prepared for maximum growth.
Thank you for reading.
Namaste.

VICUSDT 15-Minute Technical Analysis With 2:1 RewardThis chart shows a clear range-bound market, with price oscillating between a strong support and a well-defined resistance zone. Overall, momentum has been choppy, and frequent reversals are visible.
Support and Resistance
At the top of the chart, you have the Resistance Zone marked at 0.3498 USDT. This level has been tested multiple times and rejected. Each attempt to close above this area resulted in sharp selling pressure, confirming it as a significant ceiling for price action.
A slightly lower level, labeled Safe Take Profit, is set at 0.3392 USDT. This is a strategic target that allows traders to secure gains before price collides with the stronger resistance.
The lower part of the range is defined by Strong Support around 0.2845 USDT. This support level has been respected after previous sell-offs, showing that buyers have consistently defended this zone.
Trend and Structure
Market structure is consolidative. Price has printed lower highs over several sessions, but at the same time, it has held onto higher lows closer to the support. This compression indicates an upcoming breakout, either toward the resistance or through the support.
Short-term momentum is indecisive. The colored moving average ribbon you applied (likely a Supertrend or fast EMA) flips repeatedly between red and blue, showing the market has no persistent trend.
A notable volatility spike occurred during one of the recent candles, sweeping the lows and immediately rebounding—classic behavior near strong support. This long wick suggests that some stop-loss liquidity was taken, and buyers reacted swiftly to reclaim the level.
Volume Considerations
Although the chart doesn’t show volume, it is reasonable to assume there was a volume surge during those sharp wicks, which typically precedes either a reversal or acceleration. Before entering a trade, confirming volume is critical for validation.
Current Price Behavior
The current price (~0.3028 USDT) is stuck below the mid-range, facing hesitation. The moving averages have flattened. This is a textbook sign that the market is accumulating orders in preparation for the next decisive move.
Trade Idea
Below is a simple, clear trade idea you can consider, with bullets for clarity:
• Entry: Near 0.3028 USDT, ideally after a bullish confirmation candle that closes above recent small consolidation.
• Take Profit: The Safe TP level at 0.3392 USDT, positioned just under resistance.
• Stop Loss: Just below the Strong Support at 0.2845 USDT.
• Risk/Reward Ratio: Approximately 2:1. This offers reasonable upside relative to the risk.
This setup is effective only if price holds above the support and begins to trend higher. If price fails to sustain above 0.30, it could signal a deeper retest of support.
Scenarios to Watch
If you are trading this setup, it’s important to watch for three potential outcomes.
In the bullish scenario, price holds above ~0.300 and forms a higher low. A strong bullish candle closing near 0.31 or higher would add confirmation. If this happens, the path to 0.3392 becomes more likely, and possibly even to the full resistance zone at 0.3498.
In the bearish scenario, price loses the support at 0.2845 decisively. A clean close below this level opens up downside risk, possibly accelerating liquidations from trapped long positions.
In a consolidation scenario, price remains compressed between ~0.295 and ~0.315. If this happens, patience is necessary until a breakout confirms direction.
Execution Tips
When you plan to enter this trade, consider the following:
If you enter near 0.303, monitor the next 2–3 candles carefully. You want to see buyers stepping in with higher lows and a steady move toward 0.32. If price instead hovers sideways or moves lower, be prepared to exit quickly to protect capital.
Avoid moving your stop loss further down if the trade moves against you. This is a common mistake that often leads to larger losses.
Scaling out partial profit before the final target is a smart tactic. For example, consider closing 50% of your position near 0.325 if the price shows signs of hesitation.
Summary
Your VICUSDT 15m chart reveals a clean trading range between 0.2845 and 0.3498. The market has no clear trend, but the setup you highlighted can work if buyers confirm strength above 0.30. The plan combines a relatively tight stop, a realistic target under resistance, and a favorable risk/reward profile.

VIC Faces Crucial Resistance Test After Explosive RallyVIC just popped over 100% and is now testing a key resistance trendline.
After weeks of sideways chop and downside pressure, VIC has made a strong bounce off the demand zone and is now pushing right into the falling resistance trendline.
This is a crucial level, if it breaks and holds above this trendline, we could see a shift in structure and more upside toward the next supply zone.
But if it gets rejected again, price might cool off and retest lower supports.
DYOR, NFA

VICUSDT Forming Falling WedgeVICUSDT is displaying a classic falling wedge breakout pattern, which is often seen as one of the most reliable bullish reversal signals in technical analysis. This pattern suggests that the downtrend may be losing steam and a significant trend reversal could be underway. With a well-formed falling wedge and a strong breakout confirmation, VIC is now positioned to potentially deliver impressive gains in the range of 90% to 100%+, capturing the attention of traders looking for high-potential altcoins.
Recent spikes in trading volume further validate the strength of this breakout move. Higher volume during a breakout often indicates that both retail traders and larger investors are stepping in, adding conviction to the trend reversal. This strong volume profile could drive sustained upward momentum, making VICUSDT a crypto pair worth monitoring closely over the coming weeks.
The fundamentals surrounding VIC’s project are also contributing to growing investor interest. As the crypto space evolves, innovative projects with real-world use cases and active development teams tend to attract capital faster. VIC appears to be aligning with these factors, offering a compelling combination of solid technicals and supportive market sentiment.
✅ Show your support by hitting the like button and
✅ Leaving a comment below! (What is You opinion about this Coin)
Your feedback and engagement keep me inspired to share more insightful market analysis with you!

VIC/USDT 150% !!VIC has been ranging for the past 11 days between $0.15 – $0.166, and that consolidation phase has now been broken with a strong 4H bullish candle, giving us the first solid sign of a potential trend reversal.
Entry Zone: DCA from current price down to $0.163
Target 1: $0.277
Target 2 (Full Target): $0.42
Invalidation: Close back below the broken range (~$0.15) would weaken this setup

VIC/USDTKey Level Zone: 0.1590 - 0.1600
LMT v2.0 detected.
The setup looks promising—price previously trended upward with rising volume and momentum, then retested this zone cleanly. This presents an excellent reward-to-risk opportunity if momentum continues to align.
Introducing LMT (Levels & Momentum Trading)
- Over the past 3 years, I’ve refined my approach to focus more sharply on the single most important element in any trade: the KEY LEVEL.
- While HMT (High Momentum Trading) served me well—combining trend, momentum, volume, and structure across multiple timeframes—I realized that consistently identifying and respecting these critical price zones is what truly separates good trades from great ones.
- That insight led to the evolution of HMT into LMT – Levels & Momentum Trading.
Why the Change? (From HMT to LMT)
Switching from High Momentum Trading (HMT) to Levels & Momentum Trading (LMT) improves precision, risk control, and confidence by:
- Clearer Entries & Stops: Defined key levels make it easier to plan entries, stop-losses, and position sizing—no more guesswork.
- Better Signal Quality: Momentum is now always checked against a support or resistance zone—if it aligns, it's a stronger setup.
- Improved Reward-to-Risk: All trades are anchored to key levels, making it easier to calculate and manage risk effectively.
- Stronger Confidence: With clear invalidation points beyond key levels, it's easier to trust the plan and stay disciplined—even in tough markets.
Whenever I share a signal, it’s because:
- A high‐probability key level has been identified on a higher timeframe.
- Lower‐timeframe momentum, market structure and volume suggest continuation or reversal is imminent.
- The reward‐to‐risk (based on that key level) meets my criteria for a disciplined entry.
***Please note that conducting a comprehensive analysis on a single timeframe chart can be quite challenging and sometimes confusing. I appreciate your understanding of the effort involved.
Important Note: The Role of Key Levels
- Holding a key level zone: If price respects the key level zone, momentum often carries the trend in the expected direction. That’s when we look to enter, with stop-loss placed just beyond the zone with some buffer.
- Breaking a key level zone: A definitive break signals a potential stop‐out for trend traders. For reversal traders, it’s a cue to consider switching direction—price often retests broken zones as new support or resistance.
My Trading Rules (Unchanged)
Risk Management
- Maximum risk per trade: 2.5%
- Leverage: 5x
Exit Strategy / Profit Taking
- Sell at least 70% on the 3rd wave up (LTF Wave 5).
- Typically sell 50% during a high‐volume spike.
- Move stop‐loss to breakeven once the trade achieves a 1.5:1 R:R.
- Exit at breakeven if momentum fades or divergence appears.
The market is highly dynamic and constantly changing. LMT signals and target profit (TP) levels are based on the current price and movement, but market conditions can shift instantly, so it is crucial to remain adaptable and follow the market's movement.
If you find this signal/analysis meaningful, kindly like and share it.
Thank you for your support~
Sharing this with love!
From HMT to LMT: A Brief Version History
HM Signal :
Date: 17/08/2023
- Early concept identifying high momentum pullbacks within strong uptrends
- Triggered after a prior wave up with rising volume and momentum
- Focused on healthy retracements into support for optimal reward-to-risk setups
HMT v1.0:
Date: 18/10/2024
- Initial release of the High Momentum Trading framework
- Combined multi-timeframe trend, volume, and momentum analysis.
- Focused on identifying strong trending moves high momentum
HMT v2.0:
Date: 17/12/2024
- Major update to the Momentum indicator
- Reduced false signals from inaccurate momentum detection
- New screener with improved accuracy and fewer signals
HMT v3.0:
Date: 23/12/2024
- Added liquidity factor to enhance trend continuation
- Improved potential for momentum-based plays
- Increased winning probability by reducing entries during peaks
HMT v3.1:
Date: 31/12/2024
- Enhanced entry confirmation for improved reward-to-risk ratios
HMT v4.0:
Date: 05/01/2025
- Incorporated buying and selling pressure in lower timeframes to enhance the probability of trending moves while optimizing entry timing and scaling
HMT v4.1:
Date: 06/01/2025
- Enhanced take-profit (TP) target by incorporating market structure analysis
HMT v5 :
Date: 23/01/2025
- Refined wave analysis for trending conditions
- Incorporated lower timeframe (LTF) momentum to strengthen trend reliability
- Re-aligned and re-balanced entry conditions for improved accuracy
HMT v6 :
Date : 15/02/2025
- Integrated strong accumulation activity into in-depth wave analysis
HMT v7 :
Date : 20/03/2025
- Refined wave analysis along with accumulation and market sentiment
HMT v8 :
Date : 16/04/2025
- Fully restructured strategy logic
HMT v8.1 :
Date : 18/04/2025
- Refined Take Profit (TP) logic to be more conservative for improved win consistency
LMT v1.0 :
Date : 06/06/2025
- Rebranded to emphasize key levels + momentum as the core framework
LMT v2.0
Date: 11/06/2025

#VICUSDT shows signs of reversal and strength📉 LONG BYBIT:VICUSDT.P from $0.2507
🛡 Stop loss $0.2470
🕒 1H Timeframe
📍 Important Note:
Wait for confirmation around the $0.2507 level. Enter the trade only if price holds above with volume.
✅ Overview BYBIT:VICUSDT.P :
➡️ The chart shows a completed Falling Wedge — a bullish reversal pattern that typically leads to an upside breakout.
➡️ After that, a Bearish Pennant formed but failed to push the price significantly lower, indicating weakness in sellers.
➡️ Currently, the price is breaking out of the triangle pattern, hinting at a possible bullish continuation.
➡️ Entry level marked at $0.2507, right after the breakout zone, supported by steady volume and short-term uptrend.
➡️ Volume Profile on the left reveals a low-volume zone above, making it easier for price to climb toward TP targets.
🎯 TP Targets:
💎 TP 1: $0.2525
💎 TP 2: $0.2545
💎 TP 3: $0.2565
⚡ Plan:
➡️ Monitor price reaction at TP1 — partial exit recommended.
➡️ Watch for confirmation above $0.2507.
➡️ Enter LONG after retest and volume confirmation.
➡️ Set stop loss below recent low — at $0.2470.
🚀 BYBIT:VICUSDT.P shows signs of reversal and strength — holding above the breakout zone could lead to upside movement!

#VIC/USDT#VIC
The price is moving within a descending channel on the 1-hour frame and is expected to continue upward.
We have a trend to stabilize above the 100 moving average once again.
We have a downtrend on the RSI indicator, which supports the upward move by breaking it upward.
We have a support area at the lower limit of the channel at 0.2680.
Entry price: 0.2865
First target: 0.3100
Second target: 0.3346
Third target: 0.3600

ALTCOINS TO WATCH - INSANE VOLUME SPIKE! BIG MOVE LOADING?🚀 VICUSDT – INSANE VOLUME SPIKE! BIG MOVE LOADING? 🚀
“This is not just a volume increase. This is a 3,061% SPIKE. Smart money is moving—are you paying attention?”
🔥 Key Points:
✅ Massive Volume Surge – This isn’t retail noise. Someone BIG is making a move.
✅ Blue Boxes = Strong Support – But don’t just buy blindly!
✅ CDV & LTF Breakouts = Must-Have Confirmation – We only enter when the market tells us it’s ready.
💡 The Game Plan:
Watch lower time frame (LTF) breakouts for entry triggers.
If CDV confirms, we have a high-probability trade.
No confirmation? No trade. Simple.
“The market doesn’t wait. The best setups don’t last. Be early, be smart, and execute like a pro.” 🔥🔥🔥
I keep my charts clean and simple because I believe clarity leads to better decisions.
My approach is built on years of experience and a solid track record. I don’t claim to know it all, but I’m confident in my ability to spot high-probability setups.
If you would like to learn how to use the heatmap, cumulative volume delta and volume footprint techniques that I use below to determine very accurate demand regions, you can send me a private message. I help anyone who wants it completely free of charge.
I have a long list of my proven technique below:
🎯 ZENUSDT.P: Patience & Profitability | %230 Reaction from the Sniper Entry
🐶 DOGEUSDT.P: Next Move
🎨 RENDERUSDT.P: Opportunity of the Month
💎 ETHUSDT.P: Where to Retrace
🟢 BNBUSDT.P: Potential Surge
📊 BTC Dominance: Reaction Zone
🌊 WAVESUSDT.P: Demand Zone Potential
🟣 UNIUSDT.P: Long-Term Trade
🔵 XRPUSDT.P: Entry Zones
🔗 LINKUSDT.P: Follow The River
📈 BTCUSDT.P: Two Key Demand Zones
🟩 POLUSDT: Bullish Momentum
🌟 PENDLEUSDT.P: Where Opportunity Meets Precision
🔥 BTCUSDT.P: Liquidation of Highly Leveraged Longs
🌊 SOLUSDT.P: SOL's Dip - Your Opportunity
🐸 1000PEPEUSDT.P: Prime Bounce Zone Unlocked
🚀 ETHUSDT.P: Set to Explode - Don't Miss This Game Changer
🤖 IQUSDT: Smart Plan
⚡️ PONDUSDT: A Trade Not Taken Is Better Than a Losing One
💼 STMXUSDT: 2 Buying Areas
🐢 TURBOUSDT: Buy Zones and Buyer Presence
🌍 ICPUSDT.P: Massive Upside Potential | Check the Trade Update For Seeing Results
🟠 IDEXUSDT: Spot Buy Area | %26 Profit if You Trade with MSB
📌 USUALUSDT: Buyers Are Active + %70 Profit in Total
🌟 FORTHUSDT: Sniper Entry +%26 Reaction
🐳 QKCUSDT: Sniper Entry +%57 Reaction
📊 BTC.D: Retest of Key Area Highly Likely
I stopped adding to the list because it's kinda tiring to add 5-10 charts in every move but you can check my profile and see that it goes on..

VICUSDT: long trade set-up!!Join our community and start your crypto journey today for:
In-depth market analysis
Accurate trade setups
Early access to trending altcoins
Life-changing profit potential
VICUSDT long trade set-up!
Buying Levels:
$0.31 to $0.29
Target Levels:
$0.55
SL: $0.22
If you find this analysis helpful, please hit the like button to support my content! Share your thoughts in the comments and feel free to request any specific chart analysis you’d like to see.
Happy Trading!!

VICUSDT(VICTION) Updated till 12-03-25VICUSDT(VICTION) Daily timeframe range. we can see a decent pull back from its new low. and making 0.1825 its recent support. it will be more optimal here if PA can get a valid close above 0.3187. fails their will send it back to trouble zone.

VICUSDT Explodes with 1100% Daily Volume Surge – Big Moves !VICUSDT Analysis
Massive Volume Surge and Key Bullish Zone
"VICUSDT is catching fire with an incredible 1100% daily volume increase. This is the kind of action that smart traders watch closely."
Why This Matters:
Green Line Zone: Around the green line, I see a great opportunity to go bullish. These levels aren’t just good; they’re promising.
Volume Power: Such a volume spike shows strong interest and potential for a major upward move.
Key Observations:
"As always, I will wait for confirmation in the form of lower time frame upward market structure breaks. CDV, volume profile, and other data will guide the entry."
This could be a fantastic opportunity. Smart money is active, and so should you be! 🚀
Let me tell you, this is something special. These insights, these setups—they’re not just good; they’re game-changers. I've spent years refining my approach, and the results speak for themselves. People are always asking, "How do you spot these opportunities?" It’s simple: experience, clarity, and a focus on high-probability moves.
Want to know how I use heatmaps, cumulative volume delta, and volume footprint techniques to find demand zones with precision? I’m happy to share—just send me a message. No cost, no catch. I believe in helping people make smarter decisions.
Here are some of my recent analyses. Each one highlights key opportunities:
🚀 RENDERUSDT: Strategic Support Zones at the Blue Boxes +%45 Reaction
🎯 PUNDIXUSDT: Huge Opportunity | 250% Volume Spike - %60 Reaction Sniper Entry
🌐 CryptoMarkets TOTAL2: Support Zone
🚀 GMTUSDT: %35 FAST REJECTION FROM THE RED BOX
🎯 ZENUSDT.P: Patience & Profitability | %230 Reaction from the Sniper Entry
🎯 DEXEUSDT %180 Reaction with %9 Stop
🐶 DOGEUSDT.P: Next Move
🎨 RENDERUSDT.P: Opportunity of the Month
💎 ETHUSDT.P: Where to Retrace
🟢 BNBUSDT.P: Potential Surge
📊 BTC Dominance: Reaction Zone
🌊 WAVESUSDT.P: Demand Zone Potential
🟣 UNIUSDT.P: Long-Term Trade
🔵 XRPUSDT.P: Entry Zones
🔗 LINKUSDT.P: Follow The River
📈 BTCUSDT.P: Two Key Demand Zones
🟩 POLUSDT: Bullish Momentum
🌟 PENDLEUSDT.P: Where Opportunity Meets Precision
🔥 BTCUSDT.P: Liquidation of Highly Leveraged Longs
🌊 SOLUSDT.P: SOL's Dip - Your Opportunity
🐸 1000PEPEUSDT.P: Prime Bounce Zone Unlocked
🚀 ETHUSDT.P: Set to Explode - Don't Miss This Game Changer
🤖 IQUSDT: Smart Plan
⚡️ PONDUSDT: A Trade Not Taken Is Better Than a Losing One
💼 STMXUSDT: 2 Buying Areas
🐢 TURBOUSDT: Buy Zones and Buyer Presence
🌍 ICPUSDT.P: Massive Upside Potential | Check the Trade Update For Seeing Results
🟠 IDEXUSDT: Spot Buy Area | %26 Profit if You Trade with MSB
📌 USUALUSDT: Buyers Are Active + %70 Profit in Total
🌟 FORTHUSDT: Sniper Entry +%26 Reaction
🐳 QKCUSDT: Sniper Entry +%57 Reaction
📊 BTC.D: Retest of Key Area Highly Likely
This list? It’s just a small piece of what I’ve been working on. There’s so much more. Go check my profile, see the results for yourself. My goal is simple: provide value and help you win. If you’ve got questions, I’ve got answers. Let’s get to work!

Vic Vinegar having a cup of coffee in the big timeBig ol cup and handle forming on the lower time frames. Looking for .65

[Dec] VIC Token Price Prediction for 2025: Will It Soar or Sink?VIC Token Price Prediction for 2025: Will It Soar or Sink?
Tg1: $0.7
Tg2: $1
Tg3: $1.5
Tg4: $3
Tg5: $5
Tg6: $10
What do you think? comment your ideas below

#VIC HTF Bought 25% here at mark price, will DCA down if price comes for it, aim is to average out in to next few months if we get chance

VICTION - TargetsVIC can break the main resistance level and get to the next resistance levels shown on chart.

Viction (VIC)Viction, formerly TomoChain, is a people-centric layer-1 blockchain, offering zero-gas transactions and enhanced security to make Web3 easy and safe for everyone.
Anyway, VIC's start was an upward phase, followed by a correction wave. It seems VIC is moving in a big, flat triangle pattern. Recently, VIC started an upward wave going toward the triangle's upper line. Let's see what happens.

VICUSDTThe price breaks its falling wedge pattern which indicates a bullish reversal towards 0.6456 level that 61% from 0.4008 🚀🎯✅

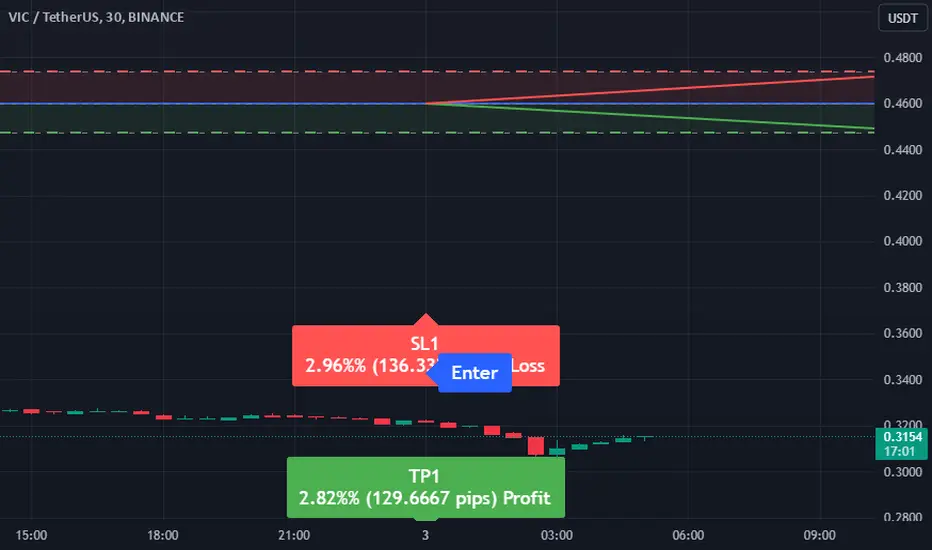
Trade Alert: VICUSDT Movement PredictionDirection: Sell
Enter Price: 0.46
Take Profit: 0.44703333
Stop Loss: 0.47363333
This trade alert is generated using the EASY Quantum Ai strategy, which leverages advanced algorithms to identify optimal trading opportunities.
The current analysis indicates a bearish momentum for the VICUSDT pair. Several factors contribute to this prediction:
1. Technical Indicators: The chart analysis reveals that the currency pair has been forming lower highs and lower lows, suggesting a downtrend. Key indicators like the Relative Strength Index (RSI) and Moving Average Convergence Divergence (MACD) also show signs of weakening buying pressure.
2. Volume Analysis: There's a noticeable decrease in trading volume, indicating a potential lack of investor interest in driving prices higher. Typically, reduced volume following a price increase can signal an imminent reversal.
3. Market Sentiment: Sentiment analysis across major forums and news sources hints at a growing inclination towards a bearish outlook, fueling selling pressures.
Based on these observations, entering a sell position at 0.46 with a take profit set at 0.44703333 and a stop loss at 0.47363333 is recommended to capitalize on the predicted downward movement. Always ensure proper risk management when executing trades.
VICUSDT Trading Signal: Buy OpportunityDear Traders,
We have identified a potential trading opportunity on the VICUSDT currency pair using our proprietary EASY Quantum Ai strategy. Here are the details:
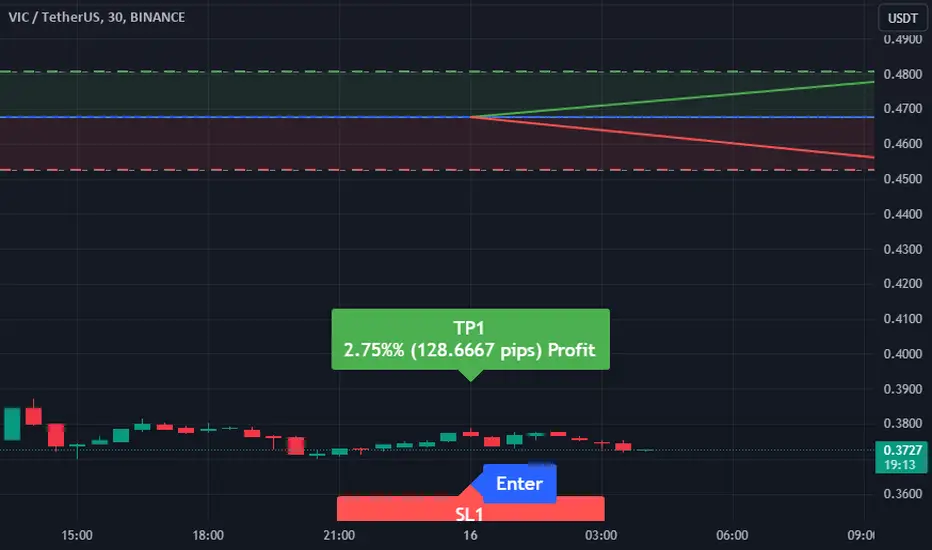
Direction : Buy
Enter Price : 0.4677
Take Profit : 0.48056667
Stop Loss : 0.45266667
Rationale Behind the Signal:
1. Technical Analysis: Our analysis indicates a bullish breakout pattern forming on the VICUSDT chart. Key indicators, including moving averages and RSI, suggest an upward momentum, signaling a strong buy opportunity at our entry point of 0.4677.
2. Market Sentiment: Recent sentiment analysis shows increased interest and positive news surrounding VICUSDT. This enthusiasm could drive prices higher, aligning with our targeted Take Profit level of 0.48056667.
3. Support and Resistance Levels: The specified Stop Loss at 0.45266667 is strategically placed below the recent support level, providing reasonable risk management while allowing potential for upward movement.
Please consider this signal as part of your broader trading strategy. As always, ensure to conduct your own analysis before making any trading decisions.
Happy Trading!
EASY Quantum Ai Team
VIC/USDT (Bullish Signal)Based on monthly candle, it's form a bullish engulf. Our entry and TP level as below:-
Entry based on bullish engulfing (daily): 0.3542
Exit based on bearish engulfing (daily/monthly): 0.9509
Our profit target:169%
#DYOR #VIC #NFA
