VIDT - UpdateVIDT is approaching the edge of its current trading channel. Caution is warranted, as a pullback to the first support level at $0.0009 remains a possibility. The next support level is less encouraging and would signal further weakness.
VIDT has struggled post-delisting, unlike projects such as ALPACA, VOXEL, and ARGO, which experienced a resurgence. At this point, VIDT is showing little sign of recovery and may even be considered a dormant or "dead" coin. ATM it is very indecisive.
That said, if buying interest returns, a move toward the $0.003–$0.006 range is feasible — a modest recovery that would place the market cap between $3M and $6M, still far below the FWB:30M cap it held before the major sell-off.
VIDTUSDT trade ideas

VIDT - Die or FLYUPDATED Chart with travel channels:
VIDT got absolutely nuked after the Binance delisting announcement, leading to a brutal sell-off and a local ATL (all-time low). But now things are getting interesting...
🔻 Falling wedge has formed on the 4H chart — a classic bullish reversal pattern.
📉 RSI is printing bullish divergence, signaling momentum could be shifting.
📊 Volume has been fading since the dump, which often precedes a breakout.
Key Levels:
Resistance atm: ~0.0015 — needs to break this to confirm any recovery.
Target Zones: Multiple green lines overhead (based on prior structure / Fibs), with the highest one suggesting a 10x move from the local bottom.
Support: Around 0.0013 (11) — wedge support and recent lows.
The sentiment is in the gutter after the Binance news, but oversold setups like this sometimes lead to explosive relief rallies — especially if shorters get squeezed or speculators start bottom-fishing.
⚠️ Super high risk — but setups like this can offer high reward too.
🧠 Not financial advice — just watching for a potential bounce setup.
Let’s see if VIDT has one last dance in it.

VIDT BIG looser from Binance Delisting, any chance for recovery?VIDT got absolutely nuked after the Binance delisting announcement, leading to a brutal sell-off and a local ATL (all-time low). But now things are getting interesting...
🔻 Falling wedge has formed on the 4H chart — a classic bullish reversal pattern.
📉 RSI is printing bullish divergence, signaling momentum could be shifting.
📊 Volume has been fading since the dump, which often precedes a breakout.
Key Levels:
Resistance atm: ~0.0015 — needs to break this to confirm any recovery.
Target Zones: Multiple green lines overhead (based on prior structure / Fibs), with the highest one suggesting a 10x move from the local bottom.
Support: Around 0.0013 (11) — wedge support and recent lows.
The sentiment is in the gutter after the Binance news, but oversold setups like this sometimes lead to explosive relief rallies — especially if shorters get squeezed or speculators start bottom-fishing.
⚠️ Super high risk — but setups like this can offer high reward too.
🧠 Not financial advice — just watching for a potential bounce setup.
Let’s see if VIDT has one last dance in it.

VIDT - I know it's being delisted IDEAWe all know by now that VIDT is being delisted from Binance, and yes, that’s a heavy hit. But seeing this crash from 35 sats to just 5 sats in a matter of hours—it’s hard to ignore. Honestly, the urge to scoop some up here is real.
There’s a clear bullish divergence on the chart, but let’s put that aside for a second. The real point is: VIDT was among the last coins expected to be delisted according to Binance’s own community voting. Only one other coin had fewer votes.
On top of that, VIDT is still actively listed on major exchanges like KuCoin and MEXC, so it’s not disappearing. You can still hold and move your tokens—this isn’t a total rug.
Now let’s talk volume. This selloff saw over 39M in volume, which is insane for a project sitting under a $5M market cap. That kind of flush doesn't happen often—and when it does, it can present a rare opportunity.
Yes, it’s getting delisted. But value and fundamentals didn’t disappear overnight. Binance is becoming increasingly aggressive with delistings, while ironically listing more meme or low-utility tokens. Time for them to rethink what they're doing—liquidity isn't everything.
✅ I’m buying here—not financial advice, but this setup is too tempting.
🎯 Short-term potential: 2x–3x 📦 Holding the rest for the long game—let’s see how this plays out.

Is VIDT about to drop? Don’t ignore the bearish signs! (3D)Note: The funding fee for this asset in futures is very high, and it's also a highly volatile and risky asset. Be cautious when taking positions on it.
Note: This coin is on Binance's delisting red list.
Since the point where we placed the green arrow on the chart, this asset has started forming a symmetrical pattern.The pattern has generally been upward, although it eventually transitioned into a sideways movement.
We are currently in the final bullish wave of this pattern, known as wave I. The red zone marks an optimized supply area. if the price reaches this zone, it presents a potential Sell/Short opportunity.
A daily candle closing above the invalidation level will invalidate this analysis.
For risk management, please don't forget stop loss and capital management
When we reach the first target, save some profit and then change the stop to entry
Comment if you have any questions
Thank You

Short VIDT40% on 20x leverage will make generational wealth. The downside is solely based off my model prediction and current volatility measurements and that the asset is being delisted.

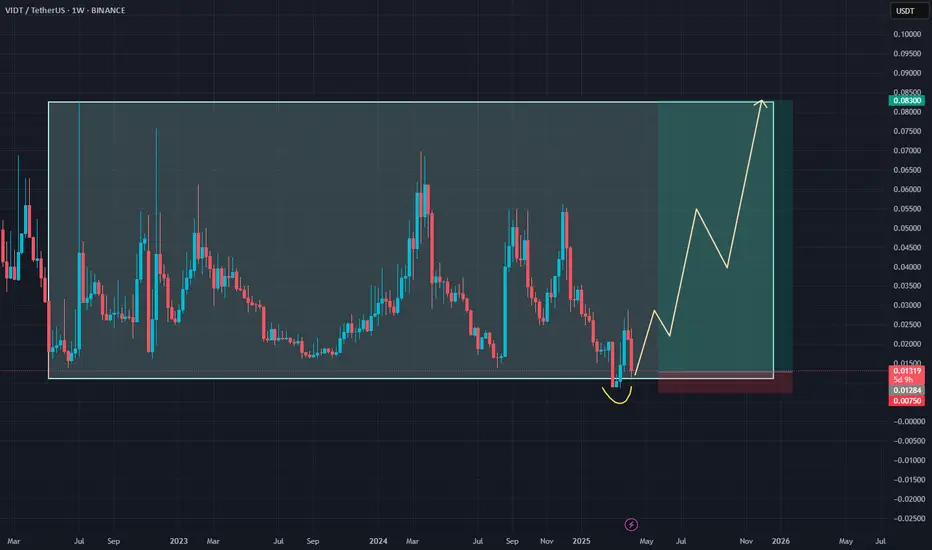
VIDT: High-Risk, High-Reward Setup at Range Low#VIDT is moving in a clear sideways range, and we’re now trading right at the lower boundary. This is a high-risk trade, but the potential reward justifies the setup—especially if we see a strong bounce from current levels.
Don’t miss the next moves—make sure to follow for more setups like this.
Entry: 0.013
TP: 0.083
SL: 0.0075
Bullish coin VIDT#VIDT Bullish continuation
TA: U Shape chart
FA: No fundamental, just like REEF TRB bullish formation.
Zoom out a little for the bigger picture

VIDT Datalink Hodl positionVIDT looks to clear the weekly descending trend-line at $0.04000 so it can commence its bull market structure.
Wait for break above and buy the strength

VIDTUSDT CHART ANALYSİS - EDUCATIONAL POSTConclusion
The NFT market is developing extremely fast, and the blockchain infrastructure has undergone significant changes over the past few years. However, today, there are still many questions about how the NFT market can function and in which areas non-fungible tokens can be used.
For example, one potential application of NFT is the blockchain recording of unique documents. Due to the reliability of the blockchain, diplomas, certificates, and various documents can be issued in NFT format, potentially helping to eliminate the risk of forgery.
NFTs are likely to have, and are already having, some impact on formats for creating and distributing content, and art objects. For now, however, it is primarily a trending investment tool for crypto enthusiasts around the world. The numerous possibilities of this technology will be revealed in the coming years.

VIDTUSDT(VIDTDAO) Updated till 28-03-25VIDTUSDT(VIDTDAO) Daily timeframe range. PA trying to hold above its 0.01233 level. it can have some relief if it gets a valid close above 0.02066. not so much retail interest it can see better day if market gets some volume.

VIDTUSDT // cup-handle formationAlthough there is a cup-handle formation on the chart, the targets are drawn according to Fibonacci. Let's look for closings above the blue line.

VIDT Return To All Time HighOnly 13M MCAP, Huge Volume Returned A Few Days Ago. I Have A Feeling This Could Pump Hard Once It Starts Moving As Mcap Is So Small. Even 0.07-8 Would Not Surprise Me

VIDTUSDT (1H) - Technical Analysis & Trade Setup📌 Market Overview:
The price is currently 0.01628, showing a potential breakout after a period of consolidation.
The trade setup suggests a long (buy) position with a favorable risk-to-reward ratio.
The price is moving towards resistance at 0.01762.
📈 Trade Plan: Long Position (BUY Setup)
🎯 Entry: At Current Market Price (CMP) ~0.01628
🎯 Take Profit Target:
First Target (Resistance Level): 0.01762
🔻 Stop-Loss:
Below 0.01484, as a break below this level could signal a reversal.

VIDTUSDTVidtusdt
Vidt will try to kiss the cloud
There is a u shape patter over there .
Don't miss out .
Targets on the 📉📉📉 cheers 🤸🤸🏌️🏌️🏌️

VIDT superbVIDT more than 71% after our Fbuy print. That's the power of 7-star.
As bull run starts we can see mega pump Fbuy prints in the future
DYOR
For indicator access, you can contact me

VIDTUSDT %180 DAILY VOLUME SPIKE! - Potential Downtrend Ahead!VIDTUSDT Analysis Potential Downtrend Ahead
Bad days might be on the horizon for VIDTUSDT. The price is approaching critical levels, and caution is key.
Highlights:
Key Levels: If the price reaches these zones, I’ll shift focus to lower time frames for potential short setups.
Market Structure: I’ll specifically look for downward market structure breaks to confirm the bearish sentiment.
Risk Management: Always prioritize risk management when trading such scenarios.
Key Observations:
"When price enters these levels, I will monitor for lower time frame market structure breaks supported by volume profile and CDV before considering any trades."
Stay sharp, and let’s see how this setup evolves! 📉
Let me tell you, this is something special. These insights, these setups—they’re not just good; they’re game-changers. I've spent years refining my approach, and the results speak for themselves. People are always asking, "How do you spot these opportunities?" It’s simple: experience, clarity, and a focus on high-probability moves.
Want to know how I use heatmaps, cumulative volume delta, and volume footprint techniques to find demand zones with precision? I’m happy to share—just send me a message. No cost, no catch. I believe in helping people make smarter decisions.
Here are some of my recent analyses. Each one highlights key opportunities:
🚀 RENDERUSDT: Strategic Support Zones at the Blue Boxes +%45 Reaction
🎯 PUNDIXUSDT: Huge Opportunity | 250% Volume Spike - %60 Reaction Sniper Entry
🌐 CryptoMarkets TOTAL2: Support Zone
🚀 GMTUSDT: %35 FAST REJECTION FROM THE RED BOX
🎯 ZENUSDT.P: Patience & Profitability | %230 Reaction from the Sniper Entry
🎯 DEXEUSDT %180 Reaction with %9 Stop
🐶 DOGEUSDT.P: Next Move
🎨 RENDERUSDT.P: Opportunity of the Month
💎 ETHUSDT.P: Where to Retrace
🟢 BNBUSDT.P: Potential Surge
📊 BTC Dominance: Reaction Zone
🌊 WAVESUSDT.P: Demand Zone Potential
🟣 UNIUSDT.P: Long-Term Trade
🔵 XRPUSDT.P: Entry Zones
🔗 LINKUSDT.P: Follow The River
📈 BTCUSDT.P: Two Key Demand Zones
🟩 POLUSDT: Bullish Momentum
🌟 PENDLEUSDT.P: Where Opportunity Meets Precision
🔥 BTCUSDT.P: Liquidation of Highly Leveraged Longs
🌊 SOLUSDT.P: SOL's Dip - Your Opportunity
🐸 1000PEPEUSDT.P: Prime Bounce Zone Unlocked
🚀 ETHUSDT.P: Set to Explode - Don't Miss This Game Changer
🤖 IQUSDT: Smart Plan
⚡️ PONDUSDT: A Trade Not Taken Is Better Than a Losing One
💼 STMXUSDT: 2 Buying Areas
🐢 TURBOUSDT: Buy Zones and Buyer Presence
🌍 ICPUSDT.P: Massive Upside Potential | Check the Trade Update For Seeing Results
🟠 IDEXUSDT: Spot Buy Area | %26 Profit if You Trade with MSB
📌 USUALUSDT: Buyers Are Active + %70 Profit in Total
🌟 FORTHUSDT: Sniper Entry +%26 Reaction
🐳 QKCUSDT: Sniper Entry +%57 Reaction
📊 BTC.D: Retest of Key Area Highly Likely
This list? It’s just a small piece of what I’ve been working on. There’s so much more. Go check my profile, see the results for yourself. My goal is simple: provide value and help you win. If you’ve got questions, I’ve got answers. Let’s get to work!

VIDTUSDT: The Tipping Point Every Trader Is Watching - VIDT DAO◳◱ On the BINANCE:VIDTUSDT chart, the Td Sequential pattern suggests a pause in volatility, potentially gearing up for a breakout. Traders might observe resistance around 0.04192 | 0.05218 | 0.06923 and support near 0.02487 | 0.01808 | 0.00103. Entering trades at 0.03207 could be strategic, aiming for the next resistance level.
◰◲ General Information :
▣ Name: VIDT DAO
▣ Rank: 1044
▣ Exchanges: Binance, Kucoin, Mexc
▣ Category / Sector: N/A
▣ Overview: VIDT DAO project overview is currently unavailable. I'll try to update this in the upcoming analysis.
◰◲ Technical Metrics :
▣ Current Price: 0.03207 ₮
▣ 24H Volume: 2,649,650.101 ₮
▣ 24H Change: 0.564%
▣ Weekly Change: N/A%
▣ Monthly Change: N/A%
▣ Quarterly Change: N/A%
◲◰ Pivot Points :
▣ Resistance Level: 0.04192 | 0.05218 | 0.06923
▣ Support Level: 0.02487 | 0.01808 | 0.00103
◱◳ Indicator Recommendations :
▣ Oscillators: NEUTRAL
▣ Moving Averages: STRONG_SELL
◰◲ Summary of Technical Indicators : SELL
◲◰ Sharpe Ratios :
▣ Last 30 Days: N/A
▣ Last 90 Days: N/A
▣ Last Year: N/A
▣ Last 3 Years: 1.77
◲◰ Volatility Analysis :
▣ Last 30 Days: N/A
▣ Last 90 Days: N/A
▣ Last Year: N/A
▣ Last 3 Years: 2.17
◳◰ Market Sentiment :
▣ News Sentiment: N/A
▣ Twitter Sentiment: N/A
▣ Reddit Sentiment: N/A
▣ In-depth BINANCE:VIDTUSDT analysis available at TradingView TA Page
▣ Your thoughts matter! What do you think of this analysis? Share your insights in the comments below. Your like, follow, and support are greatly valued and help sustain high-quality content.
◲ Disclaimer : Disclaimer
The content provided is for informational purposes only and does not constitute financial, investment, or trading advice. Always conduct your own research and consult a qualified professional before making any financial decisions. Use of the information is solely at your own risk.
▣ Explore the Power of Charting with TradingView
Unlock a wide range of financial analysis tools, data, and features to elevate your trading experience. Take a tour and see the possibilities. If you decide to upgrade your plan, you can receive up to $30 back. Discover more here - affiliate link -

VIDT/USDT: Momentum Building for a Breakout
VIDT/USDT is approaching a pivotal moment, hovering near a key trendline resistance. The current structure indicates increasing pressure, suggesting that a decisive move could be on the horizon. The price action and momentum are worth monitoring closely as we await confirmation of the breakout.
Key insights:
- Trendline resistance is being tested, and a successful breakout could pave the way for a significant bullish move.
- Indicators like RSI and MACD hint at strengthening momentum, aligning with the potential for a breakout.
- Volume will play a critical role in validating the move.
Tips for trading this setup:
- Wait for a confirmed breakout with a 4H or daily candle closing above the trendline.
- A retest of the breakout zone as support can offer a safer entry point.
- Monitor trading volume for a noticeable spike, as it often confirms the breakout's strength.
- Manage risks with a stop-loss just below the trendline to minimize potential losses.
Potential targets can be identified based on nearby resistance zones, offering attractive opportunities if the breakout succeeds. This analysis is for educational purposes only—always conduct your own research and trade responsibly. Keep VIDT/USDT on your watchlist for this exciting setup!

vidtusdt - short term trading ideaInitially, I anticipate Litecoin moving towards $0.037 or $0.033, followed by a potential pump above $0.06. There's a possibility it could dip even lower, especially with Bitcoin showing weakness at current levels If Bitcoin drops bellow $80K all hell will break loose. Patience is key—observe the market closely. After breaking above $0.06, we could see a push beyond $0.1. I know Vidt is lagging behind, but I still believe it could be gainer in near future. Vidt usually pumps with delay.

VIDTUSDT | Buy Now, Thank Later | Near Term (4HR)VIDTUSDT | Buy Now, Thank Later | Near Term (4HR)
Its Ready to Go
BTCUSDT | Alts Poised to Explode | Near Term (2H)
MYRIAUSDT | Interested to see where this goes | Mid Term (2D)
Mock Up Price Action for VRA w/ Timeline | Mid Term (3D)
Mock Up Price Action for XCH | Mid Term (12HR)
OGNUSDT | Interested to see where this goes | Mid Term (3D)
Mock Up Price Action for CSPRUSDT | Near/Mid Term (2D)
VIDTUSDT | Interested to see where this goes | Mid Term (3D)
RAREUSDT | Interested to see where this goes | Mid Term (3D)
Mock Up Price Action for ALGOUSDT | Mid Term (12HR)

VIDTUSDT | Interested to see where this goes | Mid Term (3D)VIDTUSDT | Interested to see where this goes | Mid Term (3D)
I think we're about to see something very interesting shortly

VIDT DAO Surprise? Fast & Strong: 100% Or 400%, You Choose!This will be both, a short-term (fast) move and a strong move...
I hope you are having a wonderful week, it started really good, positive news all around.
VIDTUSDT (VIDT DAO) produced a strong higher low from a mild retrace, let me explain. A bullish breakout in August produced a total of 300% growth. The entire event lasted 6 weeks, with the meat of the move being distributed across four weeks. I belief the next move will be bigger, better, brighter, faster and stronger.
This is as easy as it can get. The pairs that perform poorly, tend to repeat the same behavior over and over, again and again. The pairs that move strongly, also tend to do the same. The pairs with strong volatility are the best for short-term trades. Rather than chasing the much famed 1%, why not wait patiently and look for a reversal, like the one on this chart, aiming for an easy 100% or 300%?
The higher low is in after 5 weeks red.
I think we will see a higher high next... Buy and hold. In this case, set the sell orders beforehand, limit-sell, on target and in this case it becomes an easy, set it and forget it trade. It can be all done in 5-10 minutes, the market will take care of the rest.
Low risk, vs a high potential for reward.
I am wishing you continued success.
Thank you for reading.
Make sure to comeback for more.
This is only the beginning, the start; the Altcoins market is heating up.
We will have massive growth in the months and years to come.
Namaste.
