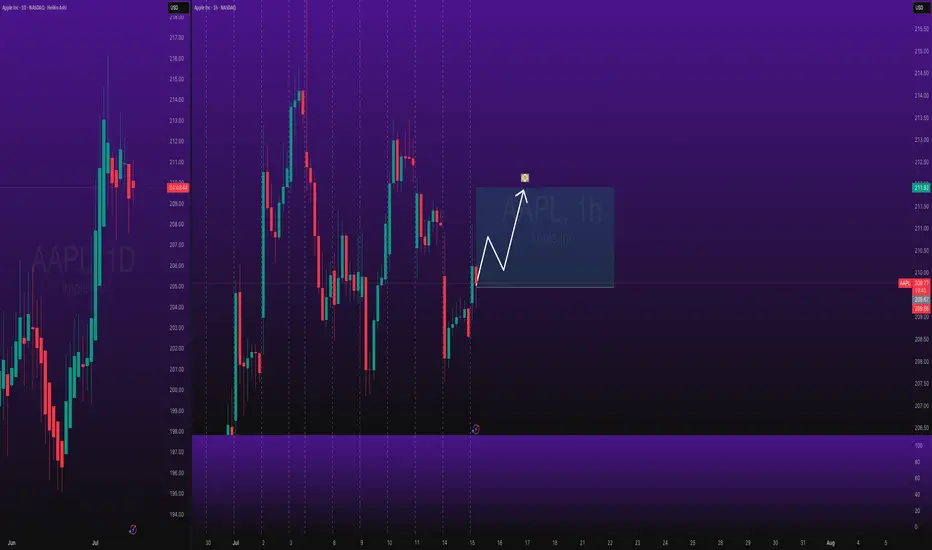
AAPL LIVE PRICE ACTION JULY 23 2025This is the price action for AAPL. I have discussed indicators as well. Do not blindly trade without understanding the logics. I am long here with stocks only.
NOTE: DO NOT BLINDLY BUY
AAPL trade ideas

Time to buy? Too much negative press. Buy in Fear- Updated 18/7Apple has significantly underperformed compared to the other Magnificent 7 stocks, but I don’t believe it’s a company you should bet against in the current climate. With a slow rollout of AI and recent statements from Apple, they may not always be first to market, but they generally execute well. The remarks regarding Sony, Samsung, and Netflix by Apple were very revealing and demonstrate a solid long-term strategy. However, there may be some bumps along the way as they work toward their goals, potentially involving acquisitions.
The fear spread in the media is similar to the FUD (fear, uncertainty, doubt) often associated with Bitcoin, and this is typically a good time to buy. Remember the saying: if retail investors miss the boat, it’s gone, but if institutions miss it, they often bring the boat back.
While this is not financial advice, based on the green weekly candle, it's hard not to pay attention, and Apple may now have a very positive year ahead! Especially with the weakening dollar and reports stating that this will benefit them greatly.
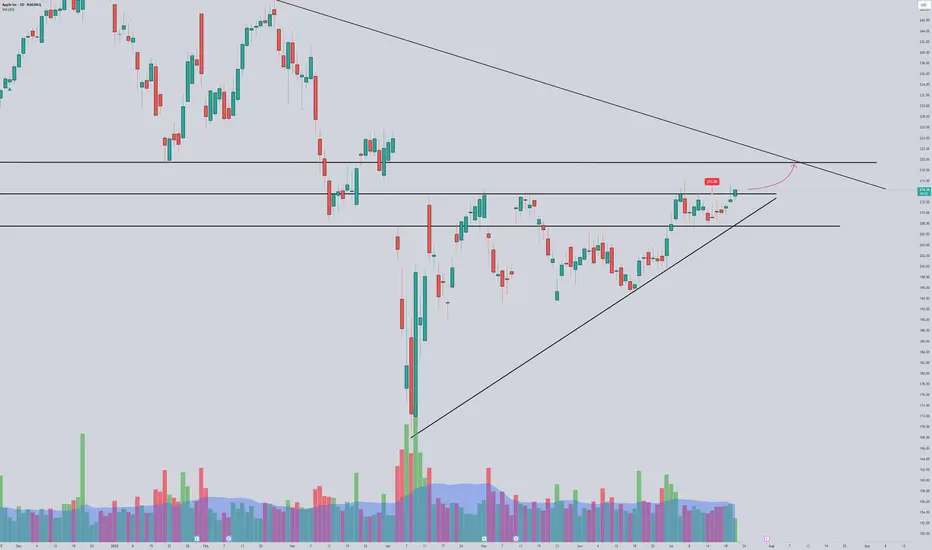
Apple has been consolidating in the 210 USD region, forming a smaller flag pattern that is nearing completion. Based on this previous pattern, the next upward move is expected to reach >$220, where consolidation will likely begin again. With Apple’s earnings rapidly approaching and stronger-than-expected results anticipated, July and August could be very positive months for Apple holders.
A golden cross appears likely, with the 50-day EMA just $5.50 below the 200-day EMA. This would be very bullish for Apple and could trigger significant interest from both institutional and retail investors. Additionally, Apple has been lagging behind the other “Magnificent Seven” stocks, experiencing considerable selling pressure; however, this trend is now reversing. Apple is shaping up to be a good short-term and long-term hold.

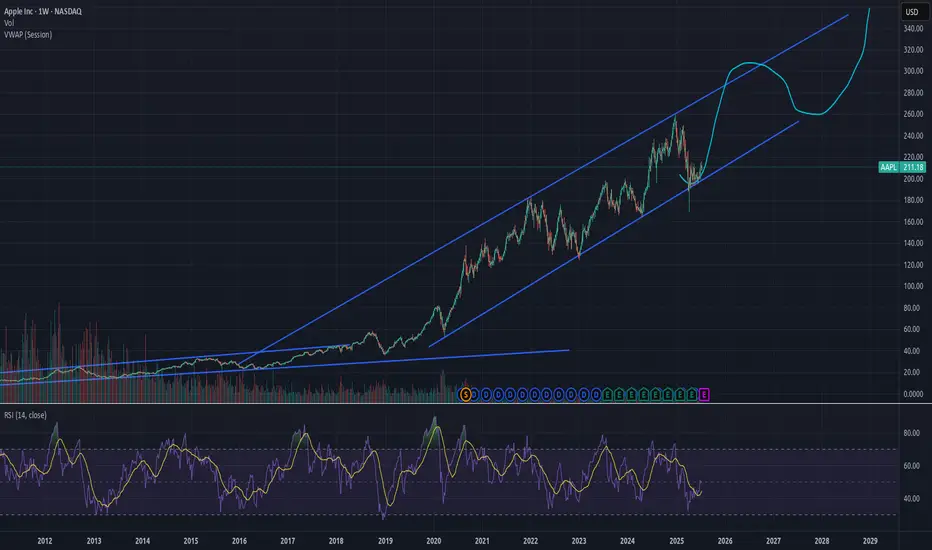
Apple - The next major push higher!🍎Apple ( NASDAQ:AAPL ) will head for new highs:
🔎Analysis summary :
Apple has been underperforming markets for a couple of months lately. However technicals still remain very bullish, indicating an inherent and substantial move higher soon. All we need now is bullish confirmation and proper risk management and this setup looks very decent.
📝Levels to watch:
$200, $300
🙏🏻#LONGTERMVISION
Philip - Swing Trader

$AAPL: Structure SurgeryResearch Notes
Original Structure:
Altering structure for experimental purposes
Angle of fib channels that rises from cycle low, has been pushed into the past to the top of first major reaction. blue area resembles the change
Reason
The the angle of Fibonacci channels which cover the general decline (from perspective of ATH to end of cycle), are adjusted to the angle of the first bear wave of smaller scale.
Therefore, when it comes to measurements of opposing forces for working out interference pattern, having this symmetric approach of mapping interconnections is fair.
Apple (AAPL) — Expected 20% GrowthThe fundamental outlook for Apple stock remains positive: the upcoming fall presentation and anticipated AI-related announcements are driving bullish sentiment.
Technical picture:
The price has broken through a key trendline, signaling a shift in momentum toward growth.
Near-term target: a move toward the 225.0 level.
Next step: a possible pullback to 214.0 for a retest of the support level.
Long-term scenario: after the correction, I expect a rise toward 250.0, which could bring approximately 20% growth within 1–2 months.
This growth potential may coincide with Apple’s upcoming earnings report and further AI news.

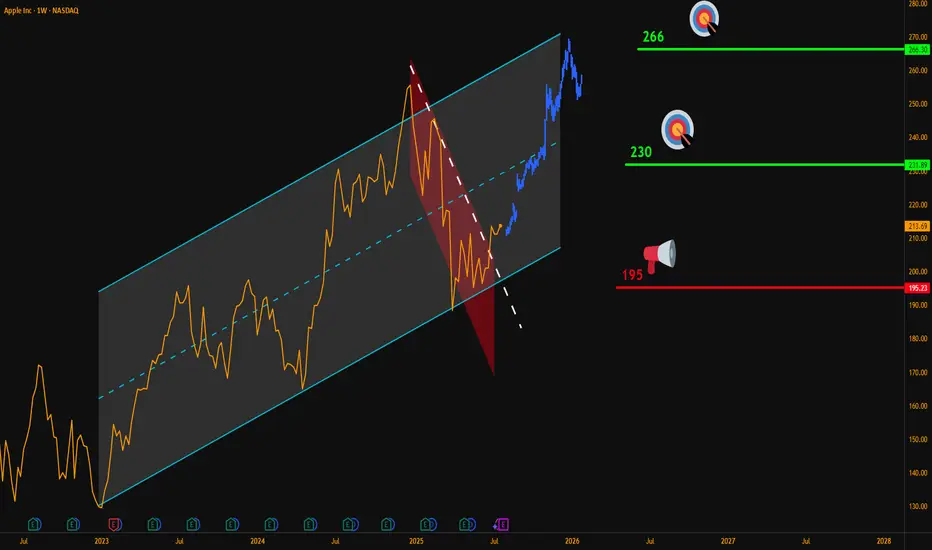
AAPL Weekly Breakout – Targeting $266Hello Traders,
Here’s my latest analysis on Apple (AAPL) based on the weekly chart.
🔍 Chart Breakdown:
Main Uptrend Channel (Blue): Price has respected this channel since 2023.
Red Downtrend Sub-Channel: Recent corrective phase is now broken.
Breakout Signal: Last week, AAPL closed above the sub-channel’s upper line, confirming bullish momentum.
📌 Updated Trade Setup Section:
Entry Zone: Around $215 (current price)
Stop-Loss: Weekly close below $195 (Risk = $20)
Targets:
✅ $230 (Reward = $15 → R:R = 0.75:1)
✅ $266 (Reward = $51 → R:R = 2.55:1)
Always confirm with your own strategy before entering a trade. Position sizing and risk control are key.
💬 Do you think AAPL can reach $266 before Q4 2025? Share your thoughts below!
NASDAQ:AAPL
AAPL next leg up?A daily close above 213.75 could set AAPL to move towards 220
We are retesting some strong resistance at 215, and above it we could see price moving faster to retest trendline.
Keeping this on the watch as ERs is not far and we can see a pre run
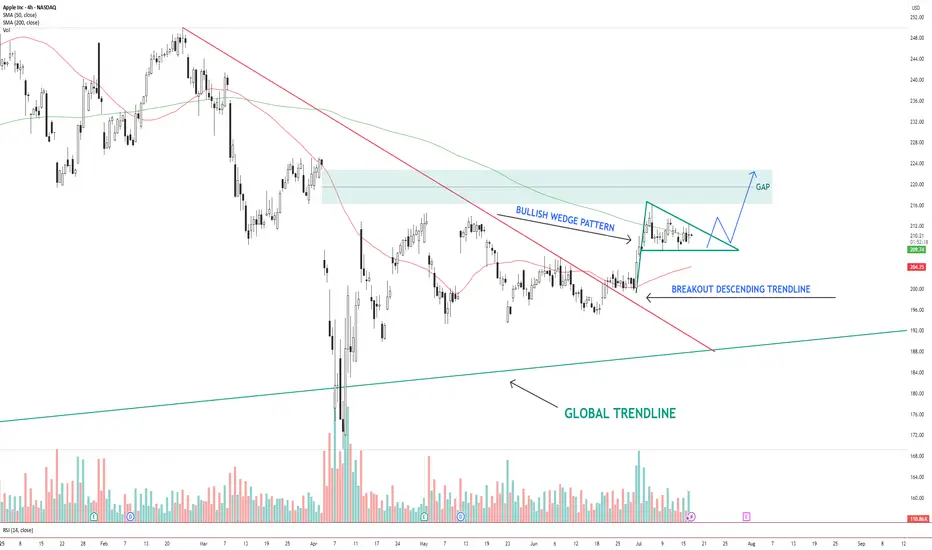
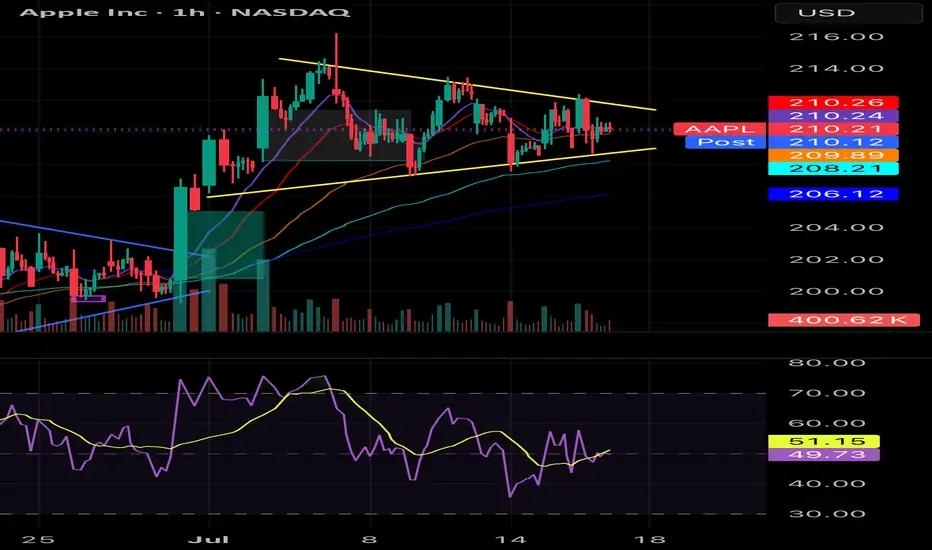
AAPL – Bullish Wedge Breakout Setup Toward Gap FillAAPL NASDAQ:AAPL has broken out of a descending trendline and is now consolidating inside a bullish wedge pattern . Price is holding above the 200 SMA and hovering near the 50 SMA.
The structure suggests a potential breakout above the wedge, with a clear gap area between $216–$224 acting as the next upside target.
Key levels:
Support: $206 (wedge base / 50 SMA)
Resistance: $216–$224 (gap zone)
Trend structure: Bullish consolidation after breakout
A clean breakout from the wedge with volume could trigger a continuation move toward the gap zone.
📌 Watching for confirmation and potential entry on a breakout + retest.
This is not financial advice. Always do your own research.
AAPL Set for a Breakout? | Technical Checklist & Projections
▍Observation & Context
▪ AAPL has been moving sideways within a clearly defined range for the past three months .
▪ On July 07 , price tested the range resistance decisively, showing some interest in the upside.
→ Let's first explore the bullish breakout scenario.
▍What Makes a Good Breakout ?
Before we talk about targets, let’s define what a good breakout looks like:
▪ A strong bullish candle breaking through the resistance in one clean move .
▪ Followed by a retest of the broken resistance (now acting as support).
▪ After that, price should ideally:
1. Form a higher low , and
2. Reach the next resistance or target zone before pulling back.
▍Target Price – Method 1: Extension of the Range
🔹 Near-Term Target: 1.5–1.618x Fibonacci Extension
- A common zone where momentum often pauses.
- Aligns with the previous high from the last downtrend.
- Technically, to reverse a trend, price needs to take out the previous high. Even though the range has “cooled off” the pressure, we still respect that level.
🔹 Ultimate Target: 2x Range Extension
- Represents a 100% projection of the previous range.
- Commonly used in range breakout targets.
🔹 Dream Target: 2.618x Fibonacci Extension
- Aligns with the start of the last downtrend , adding significance to the level.
- Often marks the exhaustion point of strong trends.
▍Target Price – Method 2: Projection from Higher Low
Note: The new higher low is not yet confirmed at the time of writing. The levels below assume an upward breakout without dropping below 207.22 . However, the same logic can be applied once the higher low forms.
🔹 Near-Term Target: Same as Method 1
🔹 Ultimate Target: 100% Projection of Prior Swing
- Projecting the prior swing (from previous low to recent high) from the new higher low .
- This level also aligns with the 1.5–1.618x Fibonacci extension of that swing, increasing its significance.
🔹 Dream Target: Another 100% projection
- Rare, but happens when momentum is very strong .
- In such cases, price might skip any retracement and launch directly into a second leg , equal to the previous swing.
- Here, the level aligns perfectly with the start of the last downtrend , just like the 2.618x extension in Method 1.
▋Mental Notes
▪ No one knows for sure if the breakout will be real or fake. But when it happens, knowing what to look for and where price might go next gives us a clear plan of action .
▪ The market will always find ways to surprise. Stay open and follow the flow.
▋Not Financial Advice
The information contained in this article is not intended as, and should not be understood as financial advice. You should take independent financial advice from a professional who is aware of the facts and circumstances of your individual situation.

APPL. Bulls are in ControlHello, I’m TheCafeTrader.
This post is for technical traders looking to capitalize on short swings and options.
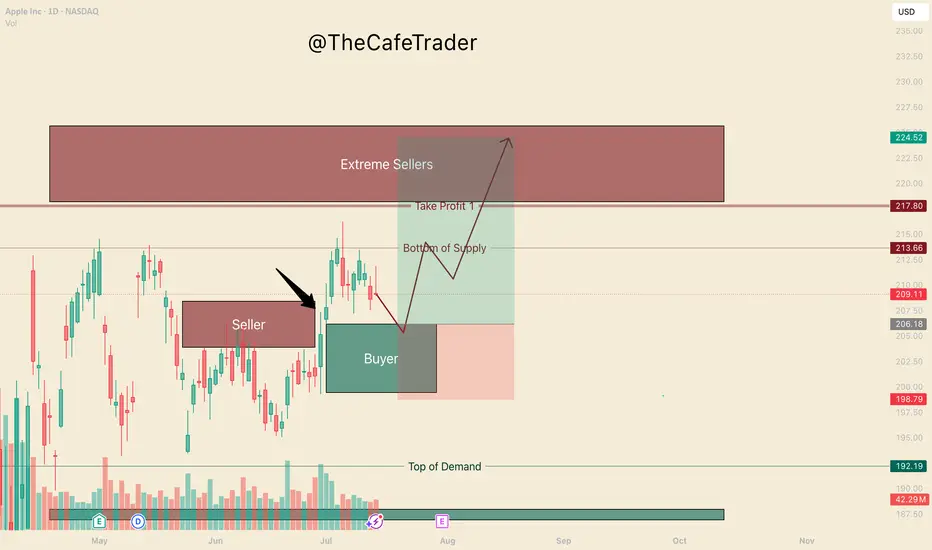
What you’re seeing here are supply and demand zones — areas where liquidity is concentrated. These levels are identified using a system built around footprint data, order flow, and market imbalances.
🔹 Key Observation:
I’ve marked a seller that price has now broken above. This tells us that buyers have overpowered a sell-side participant, and are now likely targeting deeper liquidity in the $218–$225 range.
🔹 On Apple’s Behavior:
Apple can be slow and choppy at times. So, if you’re trading options, consider going as close to the money as possible and give yourself some time on the contracts.
🔹 New Buyer in the Market:
Between $199–$206, a new aggressive buyer has stepped in. This player appears to be pressuring the first line of sellers (labeled “beginning of supply”).
🟢 My Expectation:
I expect AAPL to pull back to around $206 before catching a bid. As long as price holds above $199, buyers remain in control. In this range, I anticipate further accumulation by bulls.
🔸 Take Profit Levels:
• First TP: Just before the major selling cluster around $218
• Final TP: Deep inside the seller zone near $223
⸻
📊 Follow for more short-term analysis. This week, we’re covering both short- and long-term views of the MAG 7.
⸻
APPLE Lagging BehindApple remains a key component on my watchlist, having experienced a significant pullback amid recent market volatility driven by tariff-related macroeconomic tensions. A primary concern contributing to this weakness appears to be the company's delayed integration of AI technologies within its operating systems and hardware. There's a growing narrative among investors that Apple is beginning to resemble a legacy titan — respected but perhaps lagging behind in innovation.
That said, I believe Apple is actively developing AI capabilities behind the scenes, and any formal announcement or rollout could serve as a catalyst for a meaningful revaluation of the stock. Historically, Apple has demonstrated an ability to quietly build, then scale innovation at a massive level — and I suspect AI will be no different.
Interestingly, Apple has also exhibited characteristics of a defensive equity, often rallying even as broader global indices falter. This reinforces the notion that investors still view Apple as a relative safe haven. Given its valuation relative to long-term growth potential, Apple may be increasingly seen as an undervalued mega-cap poised for a strong rebound.
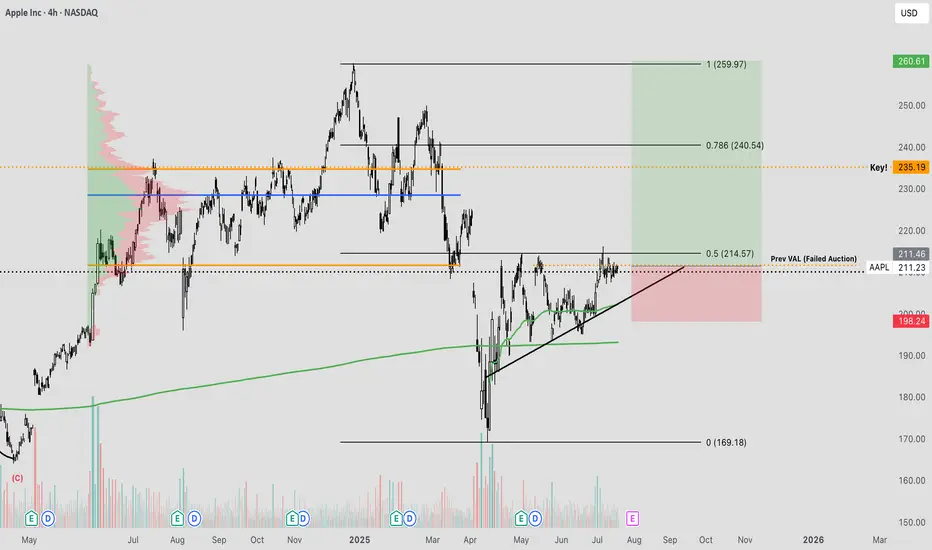
From a technical standpoint, we're beginning to see signs of accumulation, with buyers stepping in around key levels. The prior value area low around $211 has historically acted as a fair value zone. If price action successfully reclaims this level, auction market theory would imply a potential move back toward the upper end of the range — approximately $230 to $235.
Moreover, the current market structure is forming a constructive ascending pattern, with price pressing into higher zones. Should this structure hold and break through resistance, it could trigger accelerated upside momentum. This setup offers a compelling longer-term swing opportunity, particularly with clearly defined risk. The invalidation point lies just below the ascending trendline and the anchored VWAP from the lows — a key trend confirmation tool used to gauge average positioning of market participants.
All considered, this is a technically sound and fundamentally interesting level to consider an entry. Let’s see how this one unfolds.
Aapl long ideaNASDAQ:AAPL is on trendline support from March 2020 and has made a nice reversal. It looks good for a swing trade through August or September.

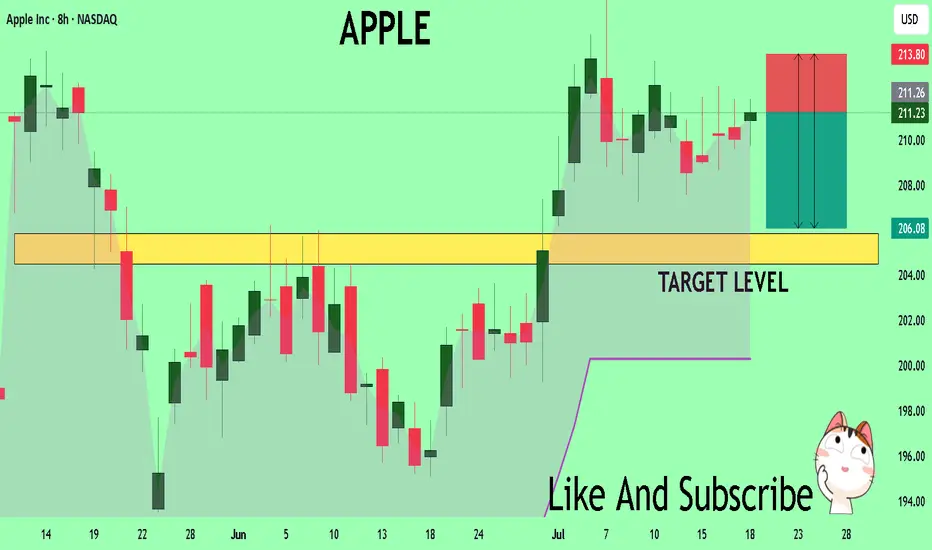
APPLE A Fall Expected! SELL!
My dear friends,
My technical analysis for APPLE is below:
The market is trading on 211.18 pivot level.
Bias - Bearish
Technical Indicators: Both Super Trend & Pivot HL indicate a highly probableBearish continuation.
Target - 205.87
Recommended Stop Loss - 213.80
About Used Indicators:
A pivot point is a technical analysis indicator, or calculations, used to determine the overall trend of the market over different time frames.
Disclosure: I am part of Trade Nation's Influencer program and receive a monthly fee for using their TradingView charts in my analysis.
———————————
WISH YOU ALL LUCK
AAPL BULLISH WEDGEApple previously wedged, and broke out into the 213s. I previously tracked it but didn't enter. As of recent the volume has been thinning and the PA has been consolidating. I believe Apple has potential to breakout once again. The EMAs are also in more of a bullish stack. Hoping to hit somewhere in the 218-230. From a technical standpoint looks good but watch for general market sentiment and other tech stocks / QQQ as many have claimed they're due for a pullback and I agree. If they move Apple moves. Nfa
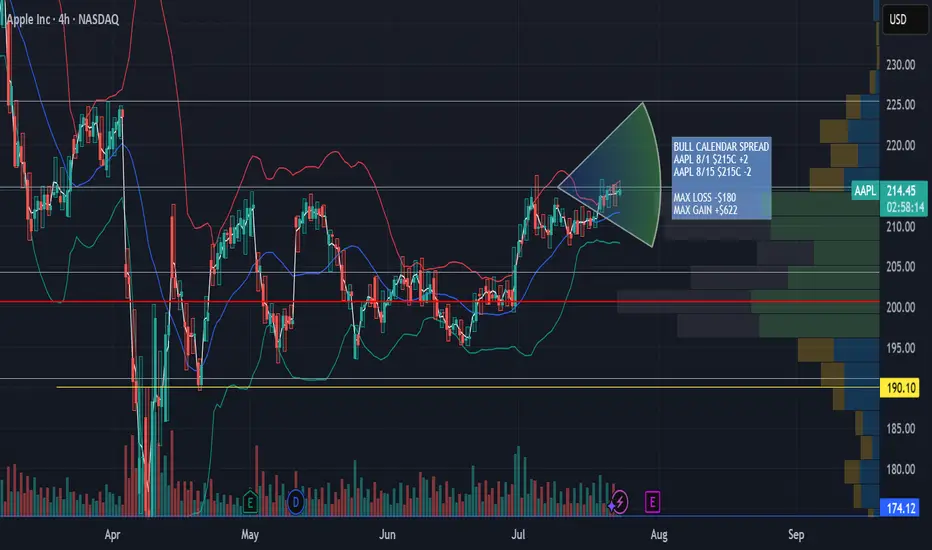
AAPL Aug 1st - Aug 8th 215 Calendar Call SpreadAAPL Aug 1st - Aug 8th 215 Calendar Call Spread
AAPL earnings after market close 7/31/25. Looking for an upward move into earnings with resistance at $225 then retesting support at $215. This zone falls between the .5 and .618 fib retracement. Great risk/ reward ratio 3.5:1
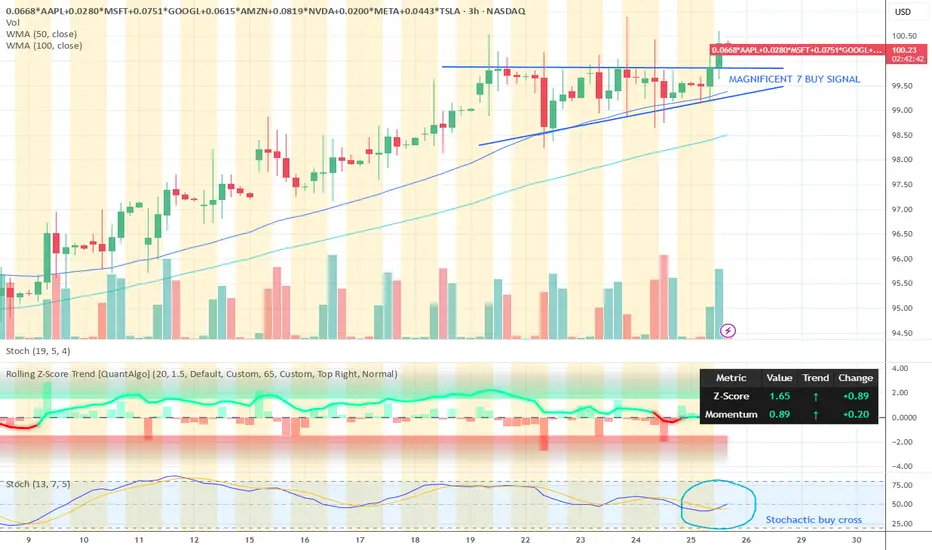
Magnificent 7 buy signalMagnificent 7 buy signal. These stocks are trading above their moving averages on 3 hour candle chart which is bullish. This basket made on tradingview consists of the 7 stocks.
Right now there is break through the resistance level and further upside is expected.
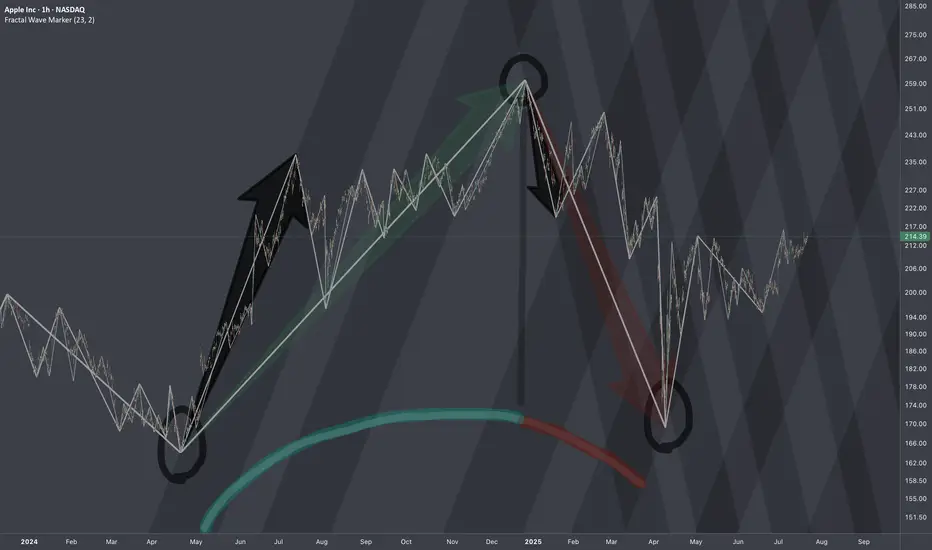
Apple: Consolidation Before Potential Breakout Toward $260Apple shares have recently pulled back into a consolidation phase. We see further upside potential in magenta wave (B) before a pullback occurs as part of the same-colored wave (C), which is expected to target the low of green wave . After that, we anticipate a new upward move: Green wave should take over—remaining above support at $168—and drive the stock toward the next major resistance at $260.10. However, if the price drops back below the $168 support level, our alternative scenario comes into play: in that case, we would expect a lower low for blue wave alt.(IV), with a probability of 32%.
📈 Over 190 precise analyses, clear entry points, and defined Target Zones - that's what we do (for more: look to the right).

Stocks SPOT ACCOUNT: APPLE stocks Buy Trade with Take ProfitStocks SPOT ACCOUNT:
MARKETSCOM:APPLE stocks my buy trade with take profit.
This is my SPOT Accounts for Stocks Portfolio.
Trade shows my Buying and Take Profit Level.
Spot account doesn't need SL because its stocks buying account.
Looks good Trade.
Disclaimer: only idea, not advice
APPL, Get Yourself a Good PriceHello This week we are breaking down the MAG7 starting with Apple.
This analysis is an aid to help you:
1 Find good price to add to your long term.
2 Hedge your current position.
3 Make a swing trade (we will touch on options pricing as well).
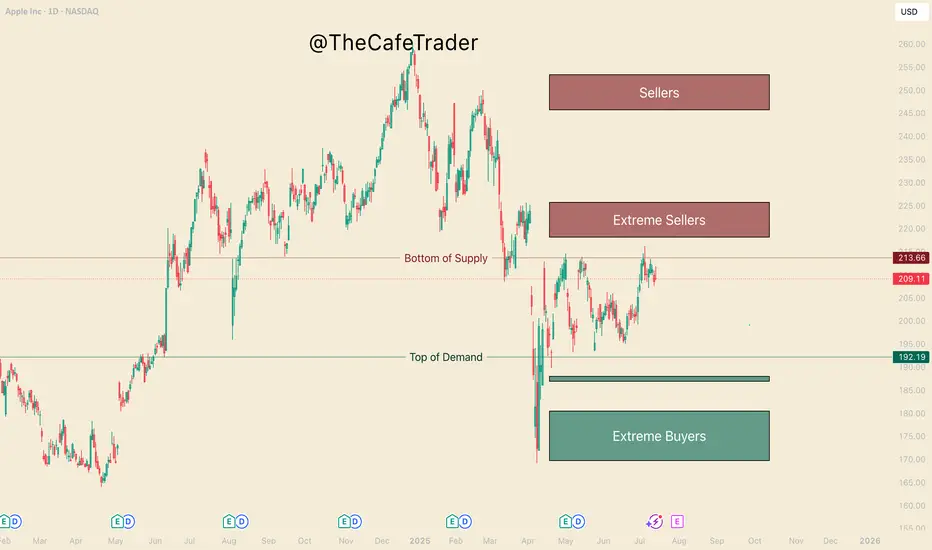
Currently Apple is 1 of 5 of the MAG 7 that had not gained a new high since Trump and the tariff scares. Many analysts have given their predictions on where Apples fair value lies and these vary. What they will not tell you is where the institutional buyers and sellers are. Not to worry, this is where we come in
Big Buyers and Big Sellers
On the chart in front of you, take a look at the 3 different buy and sell zones (otherwise known as supply and demand zones). We find these areas in using a system similar to "imbalances" if you are familiar with the footprint chart, or orderflow. If you had no idea what any of that means, not to worry, I've done the work for you.
-The lines represent the fringe of real liquidity . Using this we will be able to help you find how and when you can find a good price for your long term.
- Buyers/Sellers: strong motivated liquidity.
- Extreme Buyers/sellers Extreme demand, this is an area you could consider a steal.
1 How do you find good pricing?
Simply put - Buy with the buyers and sell with the sellers.
If you are wanting to add to your long term here are the prices. Do you want to get in ASAP? or are you willing to wait for what could be a great deal. This is important as the end of the year can greatly depend on not just picking a good stock, but finding a great price.
Buying
Fair - 192
Good - 188-187
GREAT - 180-169
Now if you are in, and maybe you want to hedge the downside (you can do this by shorting the stock, or buying put options (even more in depth you can do spreads).
For now we will just focus on Buying Put options and taking profit for swing traders.
The Burgundy line "bottom of supply" previously rejected this area twice before (May 1st, and May 14th). July 7th marks the 3rd rejection. It's important to note that the last test pushes a new high, this shows a bit of weakness from the sellers.
This weakness suggests we may see the 218-225 Sellers get tested before it comes down. The question is, How strong will the buyers be coming into this zone.
If they are aggressing this area with new REAL buyers, Then we may see this run through all these sellers and continue to run until the 245 area. If we do not find real buyers here, then likely we will reject to the pricing marked previously.
If you are holding APPLE, you can look to hedge with puts at the end of the 220-223. Since you are looking at about 5-7% downside from apple if the sellers are strong here, look to only spend 2-3% of your apple worth on puts. look for maybe 2-3 weeks out if possible.
Secondly if APPL does make a bull run to 245 you can mark this area again to hedge short term puts. look for 8-10%+ downside puts 3-4 weeks out (roughly 3-5% of your apple size)
Hedging can be very useful in wanted to keep your long term and navigate some of the ebbs and flows of the market. Notice that the risk of your puts, 2-3% & 3-5%, is half of the expected reaction from these areas. if you get a big rejection, expect these options to pay well.
NOTE: If you do not understand the implied volatility (IV's) change the price of options, it is recommended that you stay away from options until you have sufficient experience. It's also important to know how to find a good strike price, and how to know if you are getting a good price. I will be breaking down options pricing in a different time.
That's all for Apple, Stay tuned for the rest of the MAG 7!
Apple Inc Long Setup – Break, Ride, Exit Like a Pro🕵️♂️💼 “The Apple Heist: Thief Trader's Masterplan for a Clean Escape” 💸🚀
🌟 Hi! Hola! Ola! Bonjour! Hallo! Marhaba! 🌟
Welcome, Money Makers & Market Thieves! 🤑💰💸✈️
This ain’t your average stock analysis — this is a high-level blueprint for the Apple Inc. (AAPL) market heist, built using the Thief Trading Style 🔥📊.
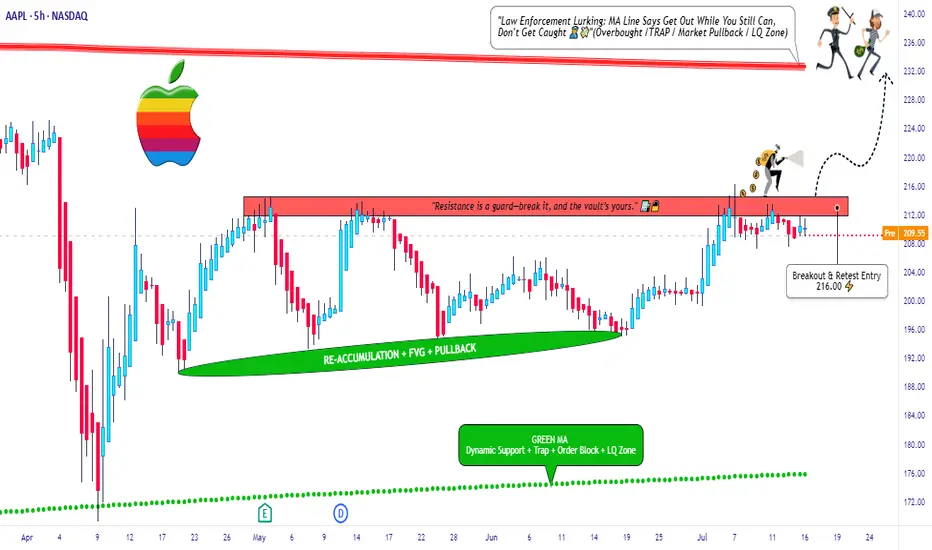
We've scouted the field using a mix of technical patterns, market sentiment, and fundamental fuel, and we’re ready to make our move. The plan is set: go long once the resistance wall cracks, and aim for a clean getaway just before the danger zone hits.
🎯 THE PLAN: INFILTRATE, ESCAPE, PROFIT
Entry Point:
💥 “The vault’s cracking – the breakout begins at 216.00!”
Place Buy Stop orders just above the resistance wall or wait for a pullback to recent swing zones (15M–30M charts work best).
📌 Set your alerts early – you don’t want to miss the opening.
🛑 STOP LOSS - YOUR BACKUP PLAN
🔊 “Listen up, crew: No stop loss until the breakout confirms! Once you’re in, place SL wisely – use the 4H swing low (200.00). Your risk, your rules. Don't get caught slippin’.”
📍 Adjust SL based on lot size, entry volume, and trade size. Protect your stash.
🏁 TARGET ZONE:
🎯 Heist Target = 232.00
(Or bail early if the heat's on – you know the drill.)
⚠️ SCALPERS & SWINGERS
💸 Long side only – don’t fight the wave.
🧲 Scalpers: Get in, grab the cash, trail the stop.
📈 Swing Traders: Hold firm. This setup has legs.
🔎 WHY WE’RE ROBBING THIS CHART:
Apple’s bullish momentum is fueled by:
📌 Strong institutional sentiment
📌 Earnings strength
📌 Index rotation and positioning
📌 COT data & macro tailwinds
Get the full scope: fundamentals, macro outlook, positioning data, sentiment, and intermarket dynamics 🔗📊.
Stay sharp – stay informed.
📰 NEWS ALERTS & POSITION MANAGEMENT
🚨 Avoid new entries during high-impact news releases.
🏃 Use trailing SLs to lock profits and exit clean.
💖 BOOST THE CREW — STRENGTH IN NUMBERS
🚀 Hit that BOOST button if this helped you steal a profitable trade. Your support powers our heist team.
Let’s keep making money the Thief Way – with style, planning, and confidence. 🎉💪🏆
📌 NOTE FROM HQ:
This analysis is for educational purposes. It’s not personalized financial advice. Manage your trades responsibly. Conditions can shift quickly — stay updated and flexible. Stay in the shadows and move smart. 🐱👤
💬 Drop a comment, hit like, share with your gang – the market's a vault, and we’re the codebreakers.
See you on the next heist, Thief Fam. 🤑🔥🕶️💼
AAPL - Weekly HV/IV PerspectiveGood evening —
I wanted to do one more write up with that being on NASDAQ:AAPL as we enter the week with futures just opening.
HV10 (16.58%) is trending -11.56% below IV (28.14%) showing a weekly price gap differential of -$2.89 on the stated implied move to what trending markets are doing. This current IV value entering the week sits 69% within the sliding year spectrum.
Now, with Apple consolidating in range for almost eight weeks after selling off when it reached its 4T milestone in December of 2024, has now begun advancing back upwards in price. The strength here is obvious and the quality of company is well, Apple.
My price targets on the week is first the upper band of stated IV ($220.58) then moving on towards the upper implied range of HV63 ($225.87). I believe the markets are going to push apple higher while balancing the indices out selling off in other areas. This would start to accelerate HV10, as it is now 91.23% coiled to its yearly lows and needs to unwind. Hopefully with a few short-term trending days increasing we find our regression.
Please come back next week and see how our position and volatility progressed forward.

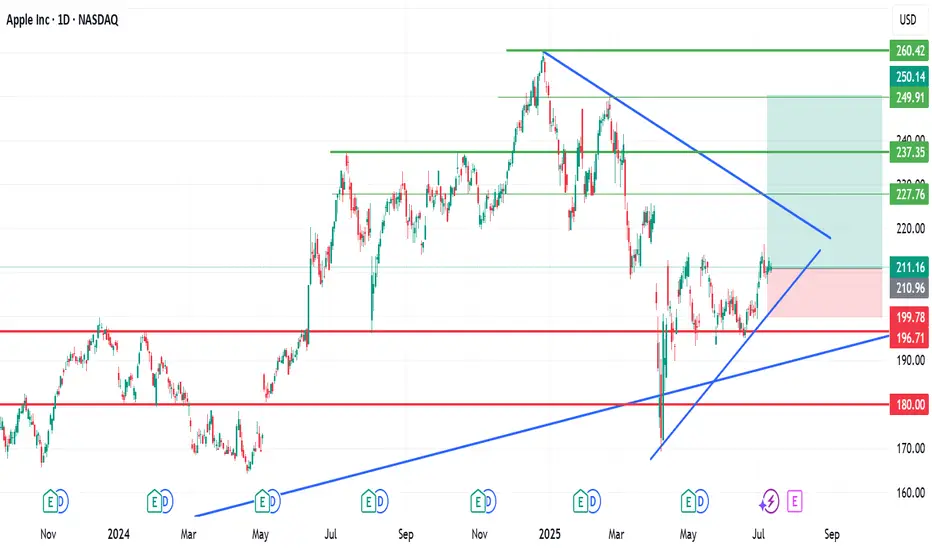
I am bullish on Apple (AAPL)I am bullish on Apple (AAPL)
Looking at my cahrt, you will seen my thoughts.
$237, $237 and $260 are my medium and long-term buy targets.
Trade with care as pullbacks are possible along the journey nortward.
Like, follow, share and comment