ABT trade ideas

$ABT ABBOTTS beats on earnings but we expect pullbackAbbotts quite simply does not miss earnings, a fantastic company and fantastic product in the ever increasing market of Diabetes treatment. Despite this we see a little stagnant price action lately and a pullback is quite possible.

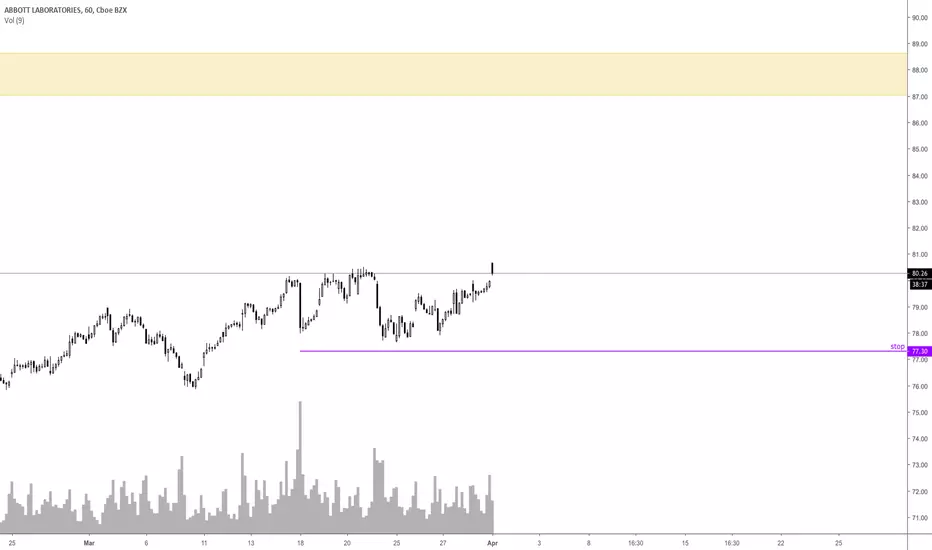
ABT earnings name with interesting after-hour session! ABT is releasing earnings today , news that worth us to keep an eye on it. Volumes during after-hours session are above 500K and there is a beautiful pullback below the 50eMA forming a clean bear flag. We would have preferred an actual gap but in this case we are talking about a top name that could make anyway a move!! After-hours conditions unless price action will start to chop around in pre-market session are nice. Let's see how it will develop, possible 73.85 / 70.53 or just keeping pulling back to the 78? No BIAS just price action. Have a nice trade everyone!!


Abbott Receives FDA Approval for Expanded Indication for MitraClABT: Abbott
2019-03-14 13:52:00
Abbott Receives FDA Approval for Expanded Indication for MitraClip(TM) Device - PR Newswire
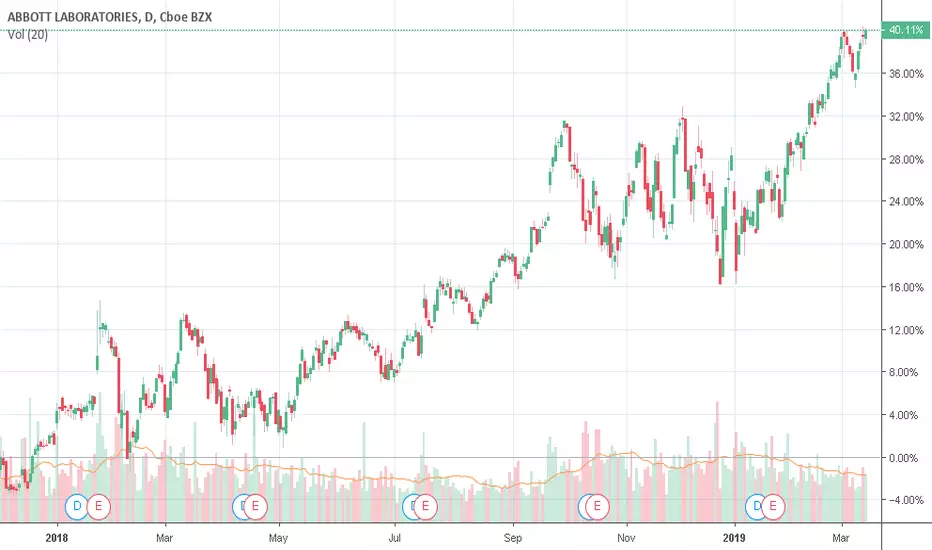
Abbott LaboratoriesDAILY
all time high levels
tendency is upward
RSI approaching 70
might retest the breakout point
volume below average

Time to unload on ABTLooking like it could be a H&S top... I would be selling here or looking at puts...


ABT - Abbott EUR hedged, correction setupLooking forward for further correction in Abbott, to weekly MA(200) / channel downside

Short ABT (Potential breakdown in the coming weeks)Watch for the breakdown of neckline, short target to ~60

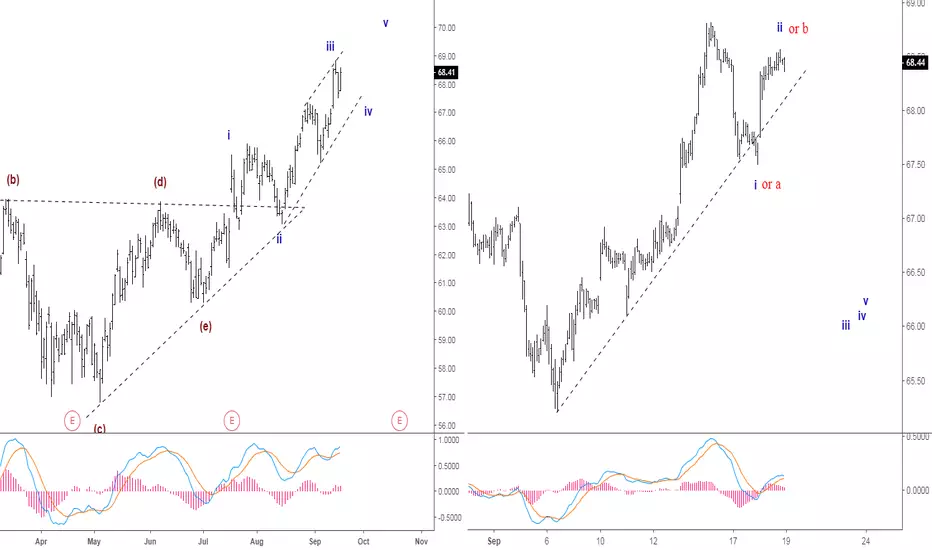
Abbott bullish for Q4 2018Abbott is currently supported by good Q3 results and the sellers are blocked by 3 key support: the EMA50, the AS1 support (strong ascending support born in july) and AS2 (mid support of the canal C1).

$ABT - GET READY DON'T SLEEP ON THIS Yo I haven't seen this type of chart in a whileeeee! Hella rare, but using my MA strategy, I call it the "Surfer Stall" lol. 55 low MA surge on top of 180 WMA where price tends to re-trace before taking the FUCK off. Just came across this one going over some intra-day scans to find setups, A+ setup & out of each chart I screenshot (regardless of if I post or not) - Surfer stalls are the least type I come by. Avg true range isn't anything to get excited about, but an OTM call for Aug makes it all the more a discount. Not even hype over that, just more of the fact that I saw this type of play when I haven't in a while lol. I think the last one I saw / posted was $KMG (). Recently changed my lower EMA's around a tad bit to shoot of better accuracy of fib (223%) re-traces, but I think this could essentially see 200% @ or around $65.72 if not 223% ($67)

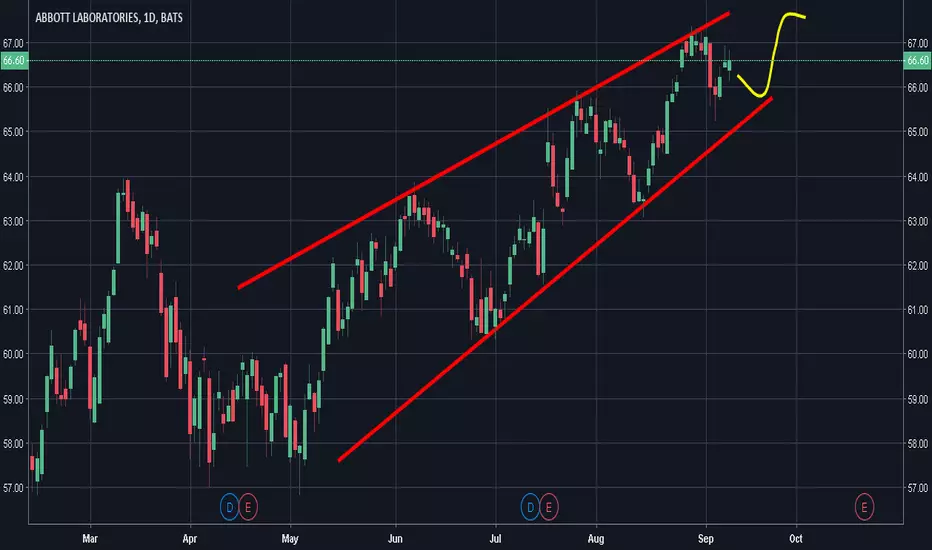
Upward channel; doesn't respect bull flagsIts currently in the middle of the channel;
I see it hitting the bottom and bouncing off upwards

ABT - Resistance broken- Broke through resistance
- Back testing on support
If there's an upward movement after the back test it could make a nice move

ABT Detected possible FDA approval!!!ABT: abbott laboratories
2018-07-12 09:00:13
Detected possible FDA approval


ABOT Up TrendABT's robust pipeline confirms positive earning for the quarter.
On the Technical aspect we can observe a monthly divergence.
Also if we move to the 4 Hour Chart we can look the break of the short trend and moving back up again .


ABT- Cup and HandleSome nice consolidation even on the rough down days as of late. With a few more days, could be a C&H

Bearish GartleyBearish Gartley with bearish divergence. Notice how price reacts to the potential reversal zone, this makes the pattern much more valid.
Measurements
- .786XA
- 1.618BC
- AB=CD
