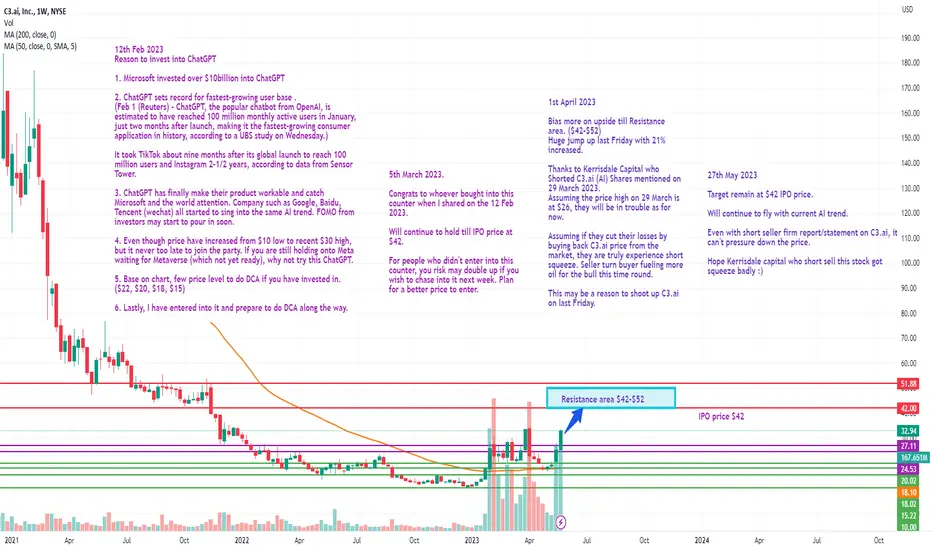
C3 Continue is bullish trend27th May 2023
Target remain at $42 IPO price.
Will continue to fly with current AI trend.
Even with short seller firm report/statement on C3.ai, it can't pressure down the price.
Hope Kerrisdale capital who short sell this stock got squeeze badly :)
AINC trade ideas
Potential Bullish Run on the Back of AI Chip NewsIntroduction:
C3.ai, an enterprise AI software company, has recently been catching attention with a new low in its price action after reaching all-time highs. With the AI sector heating up and a historical precedent in Nvidia's ( NASDAQ:NVDA ) stock soaring after AI chip news, we might be in for an interesting ride with C3.ai ( NYSE:AI ).
Analysis:
1. Company Overview:
C3.ai provides SaaS applications for deploying large-scale AI applications, and its recent financial performance shows some growth in revenues but an increasing net loss. The company has a solid financial position with a high current ratio and no long-term debt.
2. Recent Performance & Financial Metrics:
Although the company's net loss increased by 53% to $203.9M, it still managed to increase its revenues by 8% to $194.4M for the nine months ended January 31, 2023. It is also notable that the company has strong gross margins at 70.5%, although the net profit margin is negative at -98.4%.
3. Potential NYSE:GME -like Bull Run:
The recent lows after reaching all-time highs provide an interesting set-up. Drawing parallels with Nvidia's stock surge after AI chip news, we could witness another bull run in $AI. These instances are rare but can provide significant returns if correctly timed.
4. Trading Strategy:
Here is a potential trading plan:
Entry Point: Current Price at $27.85
Stop Loss: $25.00
First Take Profit Level: $36.00
For those interested in options trading, it's worth noting that the contracts are still relatively cheap.
Conclusion:
While C3.ai has been under some financial pressure, its involvement in the growing AI sector could lead to significant future upside. Given the historical context of Nvidia's stock performance after AI chip news, it's worthwhile to keep a close eye on $AI. Remember, these trading plans carry risk, and it's essential to manage your risk correctly.
Note: This analysis is for informational purposes only and does not constitute investment advice. Always conduct your own research and consult a professional advisor before making investment decisions.

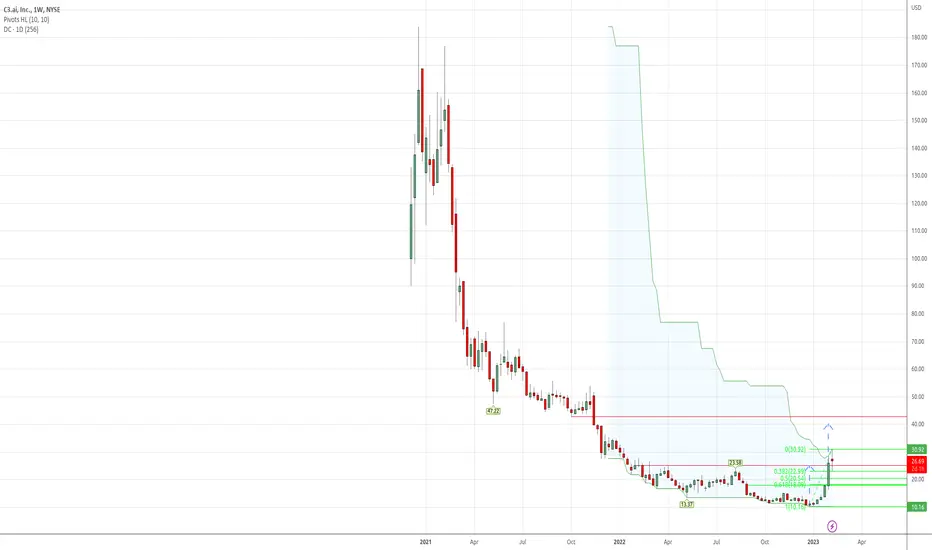
New HighWe'd got a new weekly high and have retraced 38 % whereafter new strength has emerged. As we had a rounding bottom since August there may be good space ahead for a rise.
Long Run. Life is a marathonLooks like the bottom is in. 80% sure that the bottom is in.
Impulsive looking structure of the lows.
Bear algo is still not beaten in linear scale.
Will wait a bit longer to see if the impulse is done.
Further Elliott wave and market geometry are explained in details on the video that i published.
Have a lovely day <3

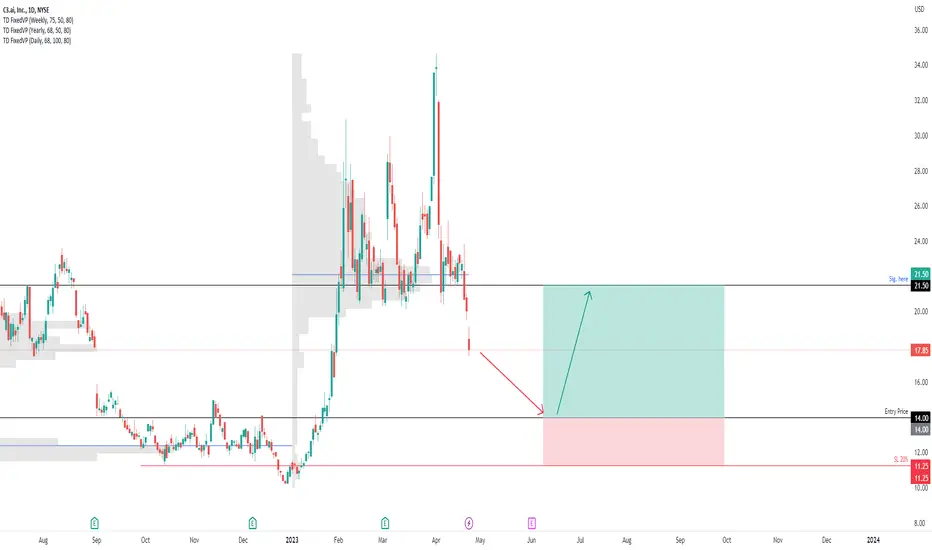
AI - RisingTrend Channel [MID TERM]- AI is in a rising trend channel in the medium long term.
- AI has given a positive signal from the rectangle formation by a break up through the resistance at 20.95.
- Further rise to 37.88 or more is signaled.
- The stock has support at 22.60 and resistance at 34.00.
- Volume tops and volume bottoms correspond well with tops and bottoms in the price.
*EP: Enter Price, SL: Support, TP: Take Profit, CL: Cut Loss, TF: Time Frame, RST: Resistance, RTS: Resistance to be Support LT TP: Long Term Target Price
*Chart Pattern:
DT - Double Top | BEARISH | RED
DB - Double Bottom | BULLISH | GREEN
HNS - Head & Shoulder | BEARISH | RED
REC - Rectangle | BLUE
iHNS - inverse head & Shoulder | BULLISH | GREEN
Verify it first and believe later.
WavePoint ❤️

$AI ABC correction and FibonacciNot financial advice.
# NYSE:AI let's see if this correction works.
it can be an ABC correction and at the same time a Fibonacci move to the upside.
time will tell!
#AI #like #subscribe

AiSince my last post when we were creating a W pattern at the low of 17$ I was saying long
So far we have played out close to a T of my expected idea (I drew it in with white squiggles ) LOl
Now ai is it my first key reistance. Also we ended up putting in a cup and handle pattern on smaller time frames with nexkline at 20.60
This key reistance we are at is also the target of that cup and handle so this are is strong resistance along with 25$. I’m not to sure how we play out from here but I do expect a potential rejection or considlation between 20.60-24$ to occure from here. I am looking for a pull ba k to 20.60-21$ from here but if it contiues up through 24 and holds that as support 25$ will be the biggest level.
Just keep a close eye on 23.80-24 Becuase this level is pretty solid reistance. It’s not a bad idea to place some shorts in to hedge the long postion if you are remaining long from 20$ or 17$ which my averge is 17.17.

MyMI Stock Plays - OpenAI - AI Trend Analysis Watching for resistance at these $23.49 Price Levels. If we break through the Red Defined Resistance, we have the opportunity to reach the 30's to 35's from our 18. 32 purchase of the stock we have currently allocated.

could be the long of our lifetimes.C3. AI.
is impulsive of the lows on 1h timeframe.
looking for a corrective retracement into the green.
Hopefully it holds and bounces of that area.
macro structure would be
1/2 then 1/2 Elliott wave wise.

good stock for day trading IMO🙌AI potential support = resistance scenario, break of trend support and I target short scalps.
long trigger is still clear break of 21, watching this one like a hawk next week!

$AI - Could see momentum from PLTR ERNYSE:AI #AI bounced from 200DMA which held up very well for 9 trading sessions signaling buyers are waiting at 200DMA around $17ish. MACD signaling a pick up in bullish sentiment. $20 and $23 are hard resistance. Upside targets - $20, $23, $26, $30. Downside risk is $15.00 to $11.70.
-----
Not an investment advice.


AiSince the 20.42-21.45 range breakdown C3 ai dropped down towards mid 16s. It’s held up for weeks down here and as of now doesn’t seem to want to drop lower. It’s possible it is gearing up for another move and hienstly I was thinking downside for weeks now. Howverr now that I’ve been watching the buyers steppin in at lower 17 range I’m starting to speculate that there’s a move to retest abive reistance again.
If ai can get some love and rocket back up a few dollars and reclaim that previous support, this drop could just be a great buyer oppertunity. Howverr just keep in mind if we get up there and retest and fail it , then the sellers could come back in heavy at those prices. I’m currently going long on AI down here and will decide how to play it when we show price action again back in the 20s


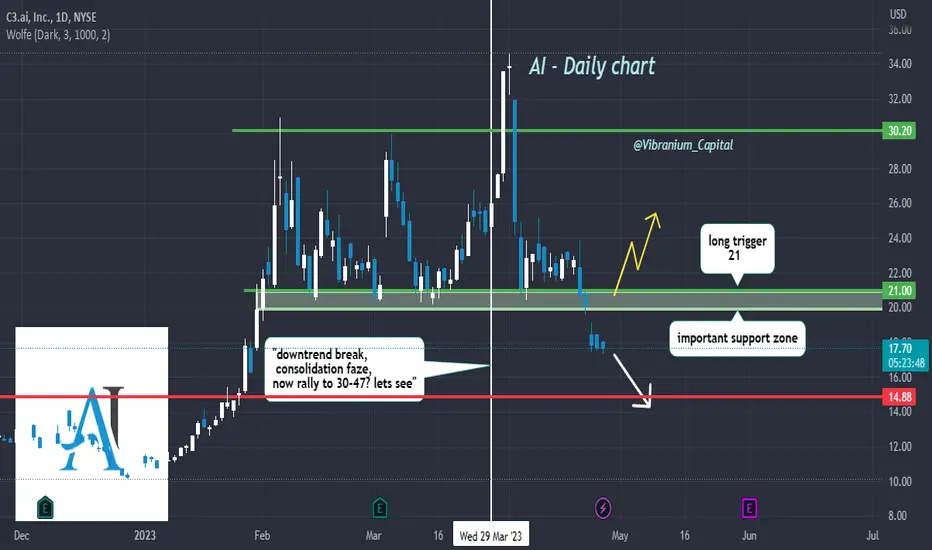
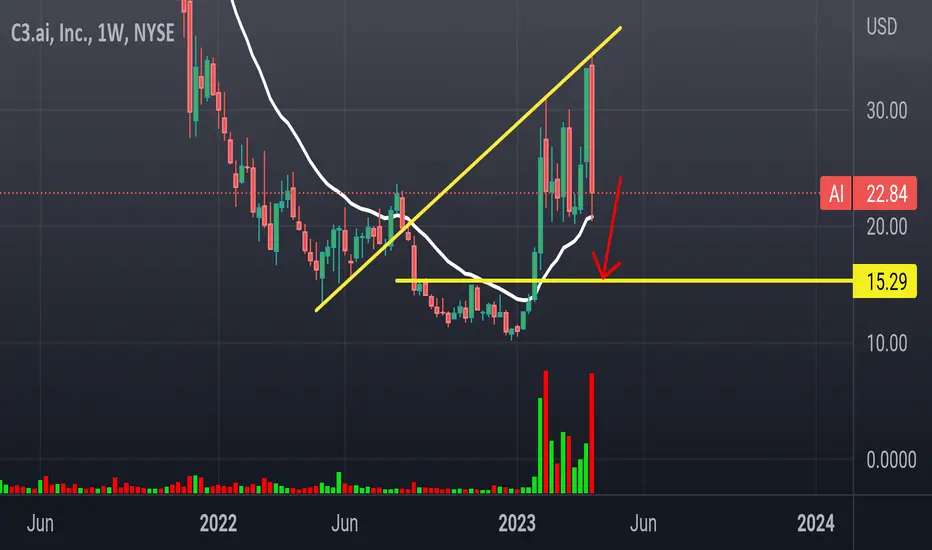
why its important to secure gains 🥶March 29th I said "downtrend break,consolidation faze, now rally to 30-47? lets see"
shortly after we smashed my target and did a heavy pullback right away..
thats why its always good to secure some gains when targets are hit, and raise stop loss to breakeven on rest of position.
now AI broke important support zone, a dip to 14.88 may be in play now..
But i will also consider longs again if we climb back above 21. no trigger no trade! boost and follow for more. thanks
AI Long ContinuationLong Idea.
Since the beginning of 2023, AI has been in a daily uptrend, currently trading above its 200 DMA. It also seems to be a favorite short candidate given its downward trajectory in 2022, so there's squeeze potential.
A distribution has been built < 15, and 20 has been acting as strong support since February, enabling price to make higher highs. Along with a higher distribution built > 20, this implies price wants to continue building or explore higher.
Buy targets: 20-22
Profit targets: 24 / 25 / 26 / 28
Long trade is invalided < 20.

C3.ai 30% Gain in the next 11 daysOK Traders. Look at the Timed Cycles on the top of my chart and the trading pattern that AI has undergone since early February. I for one am not going to let this pass me by again. Likely by Wednesday I will take a large Position as the potential for a 30% gain within 11 days is very real. I firmly believe it's worth the risk for less than 2 weeks time. The Stochastic RSI appears to be confirming this as well with the same repeating pattern. This stock is Highly Manipulated so make sure you have set Trailing Stops on your positions. As well you can see where the potential top will be so be prepared to Short near the top if you are so inclined with your trading strategy.

C3 aiMeme stock doing what memes do!
Weekly bearish engulfing
Weekly selling pressure increased..
Rsi bearish divergence
If you're looking for upside here you're chasing a squeeze.
Short entry below weekly 21ema or 20.70
Target 15.00
Waiting for a reaction before this rockets.Elliot wave double sideways combo or expanded flat in play
The Y wave can develop as a zig zag (5 /3 /5) move.
Alternatively it can develop as an impulse. Currently it looks like a zig zag since wave A was gigantic drop.
Waiting for a reaction in the green demand zone.
Will be watching for divergences on oscilators.
This is a discount in my opinion.
Long term HOLD of this asset.

AlienI was just messing around and wanted to give a chart some character. I am not a financial advisor, just someone who likes to tweek charts.

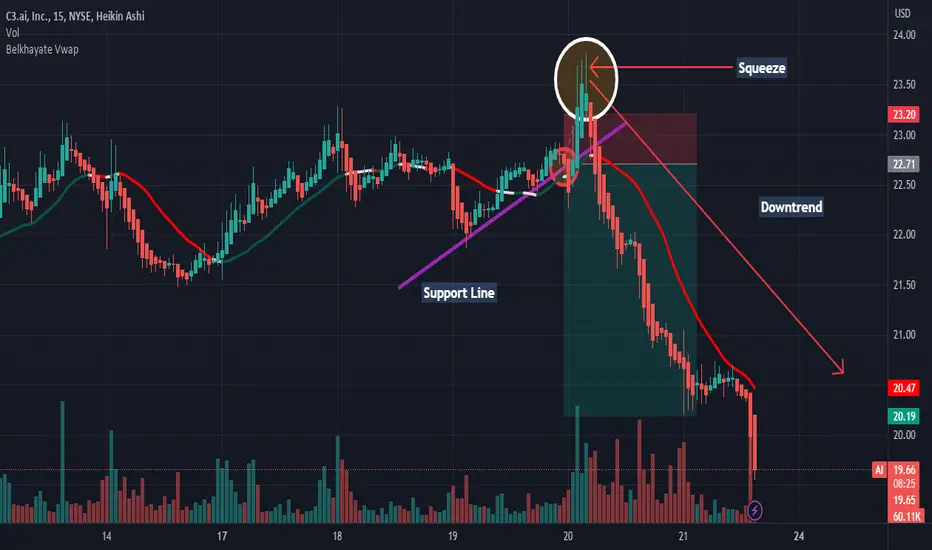
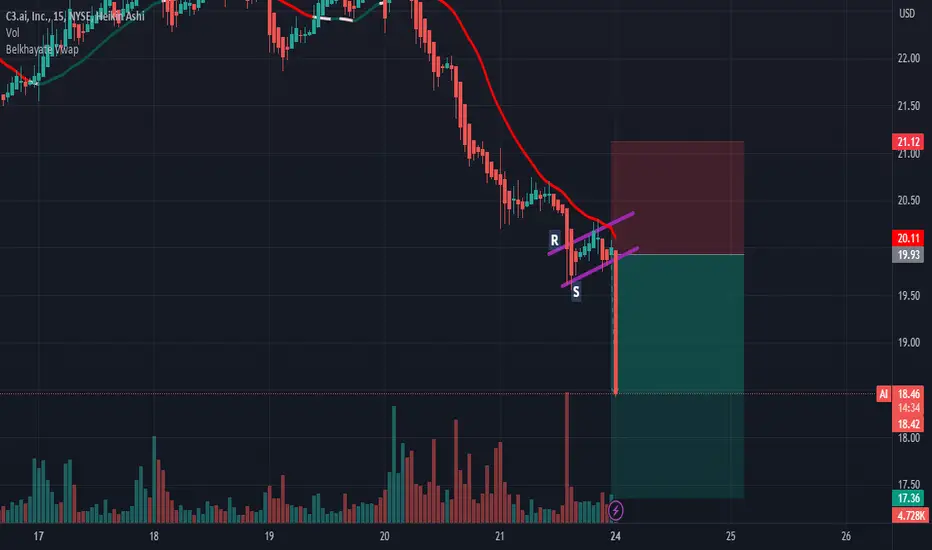
AI: Summary: SqueezeAs you can see on the chart yesterday, the buyers after the breakout of the vwap and the resistance line, they were immediately pushed back by the sellers or a true downtrend.Thanks!