Is ALB stock ready for a major rebound after a long decline?Is ALB stock ready for a major rebound after a long decline?
ALB's stock price has rebounded from a long-term upward trend near 71.65 after nearly two years of decline. Recent price rejection during the current quarter suggests a potential bottoming. ALB is facing resistance in the 107–110 zone, while support lies between 79 and 85. Although the stock remains within its broader downward trend, the reversal pattern forming this quarter could shift the momentum. However, if the stock fails to hold key levels at 79 and 71.65, a bullish reversal is unlikely to materialize.
ALBE trade ideas

Albemarle Corporation (ALB) | Chart & Forecast SummaryKey Indicators on Trade Set Up in General
1. Push Set Up
2. Range Set up
3. Break & Retest Set Up
Active Sessions on Relevant Range & Elemented Probabilities;
* Asian(Ranging) - London(Upwards) - NYC(Downwards)
* Weekend Crypto Session
# Trend | Time Frame Conductive | Weekly Time Frame
- General Trend
- Measurement on Session
* Support & Resistance
* Trade Area | Focus & Motion Ahead
# Position & Risk Reward | Daily Time Frame
- Measurement on Session
* Retracement | 0.5 & 0.618
* Extension | 0.786 & 1
Conclusion | Trade Plan Execution & Risk Management on Demand;
Overall Consensus | Buy

Temporary relief rally?I still think we are far from done, relief rally should complete Wave 4 and then a final Wave 5 will drop this one more time.
That could be invalidated if we get a very strong move up above $100 but that remains to be seen.
Dyor, not financial advice.

Covered call on ALBSTOCK HAS BEEN HAMMERED. It's at the 200 sma on the MONTHLY chart. I feel like this company and it's products will be around for a while, but I've been holding onto this dog for TOO long and If I exit at $110, I won't be upset.

Investing in Albemarle (ALB): A Strategic OpportunityAlbemarle (ALB) stock has been decimated recently, but this presents a prime opportunity for savvy investors.
If you, like me, believe in the future of lithium and electric vehicles, ALB is a stock you cannot afford to overlook.
As a leading lithium producer, Albemarle is integral to the EV revolution. The stock is a key component in many ETFs focused on batteries and lithium, alongside giants like Tesla, BYD, Panasonic, and Samsung.
With the growing demand for EVs, Albemarle's pivotal role in the supply chain ensures it is well-positioned for substantial long-term growth. Invest in ALB now to capitalize on the future of sustainable transportation.
Trading at 65% below estimate of its fair value
Earnings are forecast to grow 55% per year

Falling knife tradePotential bounce at the monthly but I wouldn’t touch this until we break the downtrend on the RSI. I think we are more likely to see a touch of the Naked Point of Control, there’s a lot of volume there around the $65 level and buyers should step in.
This is worth keeping an eye on if you’re trying to bottom fish. Just don’t catch the falling knife right now, you don’t want to be the butcher’s block!
Lithium prices are being suppressed by the Chinese, it’s hurting Albermarle’s business. There could be a lot more pain to go, be careful.

Lithium SelloffIt's difficult to determine whether or not you're catching a falling knife or buying something at a discount after a steep selloff.
Although ALB bulls have been on the wrong side of the market for the last few years, there is no time in the near future where lithium will not be an essential chemical.
Plus, on a logged chart, ALB has recently tagged its long-term trendline, now with what appears to be more upside potential than downside for those that can afford to bear the risk.

Buy the dip - long term holdI’ve been waiting a long time for this trade. Be careful out there, stop put it if necessary. Don’t get wrecked but this could be a good opportunity

Albemarle Corporation Potential Divergence!Albemarle Corporation is forming a large time frame bullish divergence that should not be dismissed. George Soros has recently started a potion in Albemarle Corporation stock. Big things could be coming down the pipe for this stock.

Albemarle (ALB)Stock rallied 7% on Wednesday yet failed to retake the 21-day EMA or the lower support line for the descending triangle. Watching this one for entry. Not ye pulling the trigger. Need more than what we saw today.

Albemarle LongThis stock ,this company has great earnings , very high ESG now testing the 200 MA on the monthly chart , a good opportunity to buy , at least 200% profit in 2-3 years.

ALB - Congratulations if you got in today below $110!! I added more to my long term account and I believe we hit hard support today at $107.67! I have a hard stop at $100 and my targets are on the chart. We've hit the bottom of this Marathon Descending Triangle .. AGAIN and it should be time for blast off. Happy Trading..

ALB falling wedge - short then long?Starting from a weekly timeframe a falling wedge nearly 7 months in the making is observed on ALB charts. Notably the wedge formation appears beside rising momentum, drawing the supposition a price bottom could be forming.
Considering trades, the question is whether a breakout is imminent or if the price will break down once more to retest the bottom of the wedge. Drilling down a 4 hour timeframe provides some insight. Has momentum failed to reach overbought, portending a drawdown? It could also be we're waiting for the final push of the current thrust...
Overbought on the 4 hour chart could be nice for a couple reasons
opportunity for short term short position (buy PUTs)
setup to sell PUTs/buy CALLs at the bottom of the wedge, especially if momentum remains in an uptrend on longer duration charts (weekly, monthly)
I recently traded the bottom side of a wedge on UNG, could there be a double trade opportunity on ALB? A drop first, then a big push through the top of the wedge?

Albemarle Corp - ALB end of correctionAlbemarle Corp has been in an Elliott steep ABC correction all the way down from ATH 335 and might have bottomed at 106 forming a cypher like pattern with:
AB = .5 of XA,
C extended 1.18 of XA &
CD retraced .798 of XC, while this is a minor deviation from a classic cypher .786 (due to a wild wick of a red candle on a day when they announced shareholder dilution) What I don’t really like is ATH C point which should be at least 1.272 of XA.
Would consider it to be a correction, and not a major downtrend coz out of ABC wave set, Wc has retraced not more than 1.618 of Wa i.e. length is 186 vs 126, hence – it’s a correction and per cypher pattern it should end as the stock observed several minor swings from 106-110 lows to resistance levels of 130-140.
110-112 recently was a demand zone being an upper band of earlier demand zone 90-112 (Sep’20 – Oct’20 candles)
To prove the cypher end of CD retracement I looked more broadly at ALB monthly chart. Over decades history it retraced twice: Apr’09 at fibo .854 and Mar’20 (pandemic) .764 meaning historically the stock gives up 75-85 per cent of preceding growth
As of March 24 point D also stands at 80 per cent retracement
Tactically it is trading within a downward channel. I would consider long once it breaks the resistance line (the upper green line) with a target first somewhere 194

ALB - Looking massive, ready for a big move?NYSE:ALB retracing inside the 0.786 and 0.709 zone from it's ATH, price doing accumulation and seemly on the search of change of trend. Massive bullish divergences on the RSI. Price currently inside and over a huge demand zone and touching exactly over the 200 EMA on monthly chart. RSI looks oversold.
Huge fundamentals on this company.

ALB - Bullish IdeaAfter finding its base, ALB is now ready to push for higher levels. 142-143 is next. Good luck

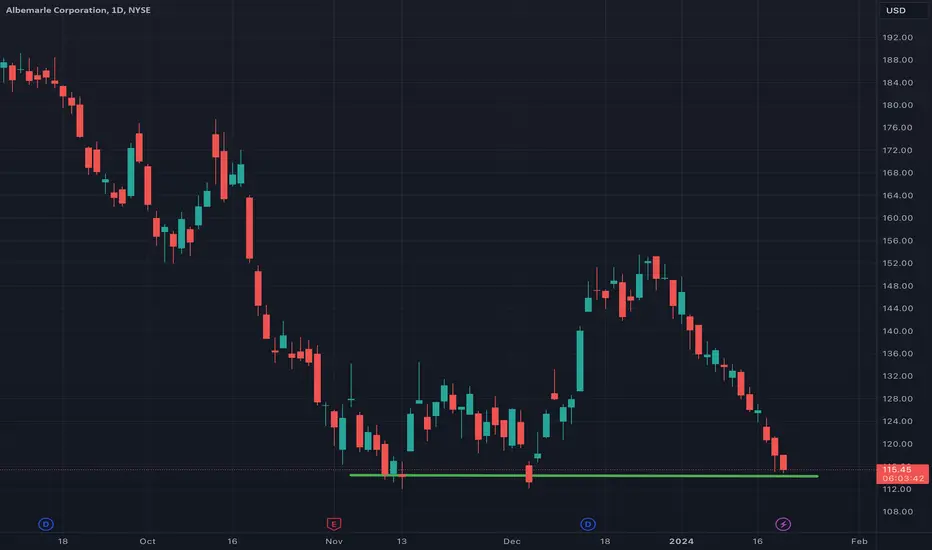
ALB is looking attractive Ideal Entry would be 115.5 to 110.
Low Risk Profit Target would be 132.
Not financial advice, Invest at your own risk.

ALB Has Bottomed All indicators point to bottom. 5th wave completed, MACD divergence, double bottom, price climbed above 50 days MA. Plus Lithium price stabilized at multi- years low.

$ALB #Albemarle Corp.NYSE:ALB NYSE:SQM NYSE:LAC AMEX:LIT
In the midst of takeoff... the electric sector is gracefully spreading its wings. 🚀 #ElectricRevolution #SustainableFuture

Looks like another reversal areaSome of the Lithium stocks made a bullish move last week and looks like this one wants to follow its peers.
Plenty of resistance here.

ALB Albemarle Corporation Options Ahead of EarningsAnalyzing the options chain and the chart patterns of ALB Albemarle Corporation prior to the earnings report this week,
I would consider purchasing the 110usd strike price Puts with
an expiration date of 2024-2-16,
for a premium of approximately $3.25.
If these options prove to be profitable prior to the earnings release, I would sell at least half of them.
Probably it`s the last dip before the reversal.


Triple Bottom?Looking at a triple bottom to stop the down trend or a absolute melt down towards covid bottom 50% lower