AMC RIP OLD FRIEND So, I thought I would put on more post out on AMC. No one and I mean no one wanted to hear anything I had to say about this stock. Thats to bad because I tried so hard. We are in the final stage of the decline. This is not trading advice for you.
AMC2 trade ideas

AMC Bullish...Since the low of May 11th, 2022; AMC made an impulse to the upside and seems to now have completed a 3 wave correction of that small impulse which for now confirms my bullish move for the next coming months. Though I was expecting price to move into the bluebox but it fell short but because of the nature of the current price action I then can now no longer look for downside because price has exhausted downside possibilities for the short term.

Rackspace, Gamestop, AMC, HYMC and others trade eerily similarMany of us know that GME , AMC , HYMC , BB , BBBY and others generally trade in a strange near identical parity within a given timeframe.
I was curious as I've recently done some research into Rackspace Technology 's ( NASDAQ:RXT ) current market situation and market history - in particular a common thread that many mysteriously struggling and now defunct companies share - that Apollo Global Management has at some point had a hand in their financial trajectory, usually following the same modus operandi, take a struggling public company private (buying all outstanding shares at the deep discount leaving most long shareholders holding the bag), doing massive gutting and PR, taking the company public again with a relatively high IPO, and mysteriously the company just never seems to succeed but becomes a prime target for heavy short selling (though not directly Apollo, the insiders involved are related in some way to Apollo, Blockbuster, ToysRUs, Sears, Caesars Casinos such as Harrah's, Claire's Jewelry, Linens n Things, to name a few billionaire_boys_club_bbc_ep_16_part_3_the_apollo/ ) - ... incidentally Apollo leaves some particular people embedded on the board of directors - people who have been involved in the rescue and ultimate dissolution of major corporations.
The theory is that this is all by design, just following a playbook. Here is a very well researched dive into the connection starting with the infamous Mike Milken and his proteges and going into the connections between this group and many high profile corporate failures. billionaire_boys_club_bbc_ep_16_part_6_the_apollo
I encourage you to read the entire series www.reddit.com
If you don't believe me, just look at "Independent Directors" Mitchell Alan Garber (incidentally was CEO of Caesars Interactive Entertainment) (and Aquisition Co. www.wsj.com and Dhiren R. Fonseca... there are more. These two were directly involved in the purchase and downfall of Caesars Casinos in particular Harrah's entire portfolio.
An example of the scheme Apollo perpetrates is described pretty well in Harrah's wikipedia article starting with its purchase and privatization, next IPO, then some finagling, and finally bankruptcy en.wikipedia.org .
Apollo Global has been busy for the past 15 years with this scheme and it's always explained away or swept under the rug through clever legal/corporate maneuvering. I wanted to raise awareness. . Some people have noticed an uptick:
www.reddit.com
And the salient point is that it all comes back to an elite circle that includes Apollo, Citadel, and others.

AMCGamestop's (GME) stock is up by more than 9% in Thursday midday trading, after it was halted four times for volatility.
The meme stock went up more than 20% during morning trading, according to a CNBC report.
During Wednesday trading, the meme stock also fell by at most 13% on Wednesday.
Another meme stock, that of theater chain AMC Entertainmemnt Holdings, (AMC), is up also more than 7% during midday trading.
It rose as high as 18% in morning trading, CNBC reported


$AMC Bullish Option Flow AMC saw bullish Call buying and Put writing today, currently trading +2.7% afterhours . I followed with the 5/20 $13 calls. Bullish confluence in RSI indicator
First line of resistance $14.8/$15 zone will take profits there, with a break to upside implying a further move to $17 zone 10 day MA (blue line)
Lot of supply overhead, move will happen fast where I would suspect a typical dump.
Use a stop loss : )
Cheers

AMC longFirst time long AMC. Did pretty well with shorts from 60 - 70. Pretty good support levels here. Long 13.

Earnings watch 5/9Earnings watch today 5/9:
SU
DUK
BNTX
LMND
HLT
AMC
BLNK
PLUG
ATER
PLTR
Do your own due diligence, your risk is 100% your responsibility. This is for educational and entertainment purposes only. You win some or you learn some. Consider being charitable with some of your profit to help humankind. Good luck and happy trading friends...
*3x lucky 7s of trading*
7pt Trading compass:
Price action, entry/exit
Volume average/direction
Trend, patterns, momentum
Newsworthy current events
Revenue
Earnings
Balance sheet
7 Common mistakes:
+5% portfolio trades, capital risk management
Beware of analyst's motives
Emotions & Opinions
FOMO : bad timing, the market is ruthless, be shrewd
Lack of planning & discipline
Forgetting restraint
Obdurate repetitive errors, no adaptation
7 Important tools:
Trading View app!, Brokerage UI
Accurate indicators & settings
Wide screen monitor/s
Trading log (pencil & graph paper)
Big, organized desk
Reading books, playing chess
Sorted watch-list
Checkout my indicators:
Fibonacci VIP - volume
Fibonacci MA7 - price
pi RSI - trend momentum
TTC - trend channel
AlertiT - notification
tickerTracker - MFI Oscillator
www.tradingview.com


#SuakuFlowsWatchlist - 5/16/22#SuakuFlowsWatchlist
$AMC C > 12.49 | P < 11.49
$GME C > 106.78 | P < 95.04
Tonight's picks are rather 'meme'-heavy but the setup looks good.
Looking for a 3-1-2 bearish reversal on both tickers.
Scale out above 20%.

amc respecting the meme linesAmc technicals show us that we are in a descending broadening wedge or megaphone. if the algos respect the pattern and we break to the upside expct the measured move to bring us back up to the previous swing high range where the buy button was shut off....what happens from there will be up to the apes. will they hodl or will they capitulate and sell??? Get your battle plans and ammo ready, doomsday is approaching fast

AMC $AMCJust the current situation of AMC.
Make AMC break out of that downtrend, if we break support, it is over.
Nobody can pick the bottom, so i post this as neutral, just as an overview of how the stocks looks at the moment.
Stay safe!

Potential End of the Downtrend (Monday May 16th)Check it out, the aqua blue and orange lines represent the downtrend we've been following since the March run-up. Today the price is being pinched between both lines. Monday could be the day. Not saying MOASS on Monday but probably time for some upward momentum.

IT IS NOW OR NEVER!!!AMC should reject and go higher or will collapse to ZERO!
TP: 91.88
SL: 9.70
GOODLUCK!

Analysis-uptrend-breakout of vwap with focreHere as you see on the chart we have a breakout with force the vwap indicator by a big candle with a large volume, so we will have a big probability of an uptrend.thanks.

An Oddly Familiar PatternAre the algorithms using the same pattern as before? Looks very similar. Going long.

$AMC: Reversal⚡Bullish Divergence on the MFI
⚡Vix Fix strong bottoming signals
⚡7.86 Fib Retracement measured from the trend reversal candle (43$), this area stands as strong support confirmed by large VPVR node
⚡TD-Sequential red 8, often reverses the trend once spotted on larger time frames
⚡Big volume support trendline at 10$
⚡Liquidity zone between 7.5-10$ (Strong support)
⚡A 3D close above the 7.86 Fib signifies the reversal
⚡Later on we have resistance at the 7.07 Fib (13.5$) confirmed by VPVR node
⚡Golden pocket Fib resistance at 15.8-17$
⚡0.5 Fib + Ichimoku Cloud resistance at 21$ + 20$
⚡Watch for a break of 14.64$ to confirm bullish price action
⚡Options Chain looking healthy, an upswing is possible at these levels
*WARNING* This thread is not financial advice. I am not a financial advisor.

AMC 3/30/2022AMC
Ticket to nowhere
That 7-day AMC pump to end May 2021 sure left behind a lot of blood.
The last 300 days since that 7-day pump, price has been moving downwards in a large price channel.
We have a death cross of 200 and 50 ema signaling the bearish conditions.
Price is currently at resistance level of price channel
Stochastic is overbought.
The last two times price has found itself at resistance area of price channel and stochastic was over-bought, price has made a move back down to support.
This time will be no different.
Yesterday’s candlestick closed a shooting star and resistance and todays closed below that. This is my cue to enter trade.
Entering trade short
Entry: 25.28
Stop loss: 31.15
Target: 11.00, +56.48%, 2.43 RR ratio

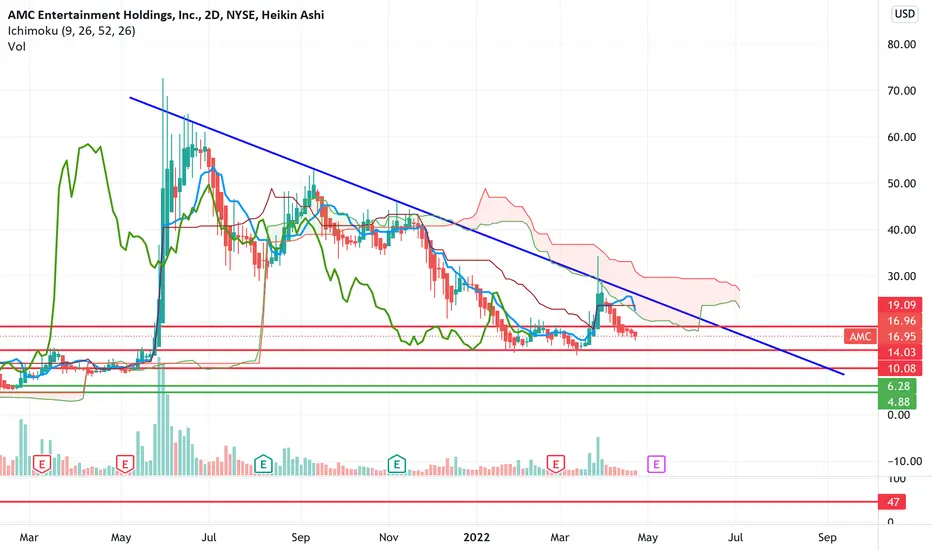
$AMC looks horrible. Downside to $4.88-6.28$AMC is forming lower lows and has just broken under resistance which sets up a move much lower.
I think price is likely to fall through the $10 support and end up somewhere between $4.88-$6.28.
Let's see how it plays out in the coming weeks.
AMC pending order to buy at 7I think a lot of people thought I was joking or trolling when I said this 60+, but I wasn't. 90% off the high is a norm for these type of mega expansions. I like to buy them 90% down. AMC is close.
Been talking about AMC short for a while. I think it's ending soon.

AMC Bullish! Alternate view in play from last weeks analysis...
We are still bullish on AMC, but however a slight change occurred when price broke below 12,72 meaning that the price is now completing a 11 swing sequence (WXYXZ) to the bottom of the channel and expecting to bounce from around the bluebox area of 8,30 and (not expected to go below the bluebox(5.23) from which we will invalidate our analysis).

AMC likely to fully crash before end of year As the AMC crash continues after looking at their recent quarter financials I believe we could see $1-2 or lower before year end. AMC is highly unprofitable and burning hundreds of millions every quarter with no sight of profitability in the near future. Their current cash is $1.165 billion from $1.592 the previous quarter, a reduction of $427 million. On top of that their share count increased from 400 million to 515 million. Even with some cash in hand the dilution spiral seems to have already begun and will accelerate as their cash reserve deplete.
At most this company is worth $1-2. Their previous best earning were around $1 a share with current revenue far below their previous peak. Even if they get back to peak earnings they have a incredibly larger interest expense. With the already heavy dilution that’s previous peak of $1 EPS is only 20 cents now. 20 cents EPS at a 10 PE is $2.
