Archer Daniels Midland (ADM) - Investment Outlook for 2025
Comprehensive Analysis & Valuation of Archer Daniels Midland (ADM) - Investment Outlook for 2025
Archer Daniels Midland (ADM), one of the world’s leading agribusiness companies, presents an attractive opportunity for value and income-focused investors, particularly in today’s uncertain macroecono
Key facts today
Next report date
—
Report period
—
EPS estimate
—
Revenue estimate
—
2.610 EUR
1.74 B EUR
82.59 B EUR
477.13 M
About Archer-Daniels-Midland Company
Sector
Industry
CEO
Juan Ricardo Luciano
Website
Headquarters
Chicago
Founded
1902
FIGI
BBG00P0PC772
Archer-Daniels-Midland Co. engages in the production of oilseeds, corn, wheat, cocoa, and other agricultural commodities. It operates through the following segments: Ag Services and Oilseeds, Carbohydrate Solutions, Nutrition, and Other. The Ag Services and Oilseeds segment includes activities related to the origination, merchandising, transportation, and storage of agricultural raw materials, and the crushing and further processing of oilseeds such as soybeans and soft seeds cottonseed, sunflower seed, canola, rapeseed, and flaxseed into vegetable oils and protein meals. The Carbohydrate Solutions segment consists of corn and wheat wet and dry milling and other activities. The Nutrition segment serves various end markets including food, beverages, nutritional supplements, and feed and premix for livestock, aquaculture, and pet food. The Other segment refers to the company's remaining operations. The company was founded in 1902 and is headquartered in Chicago, IL.
Related stocks
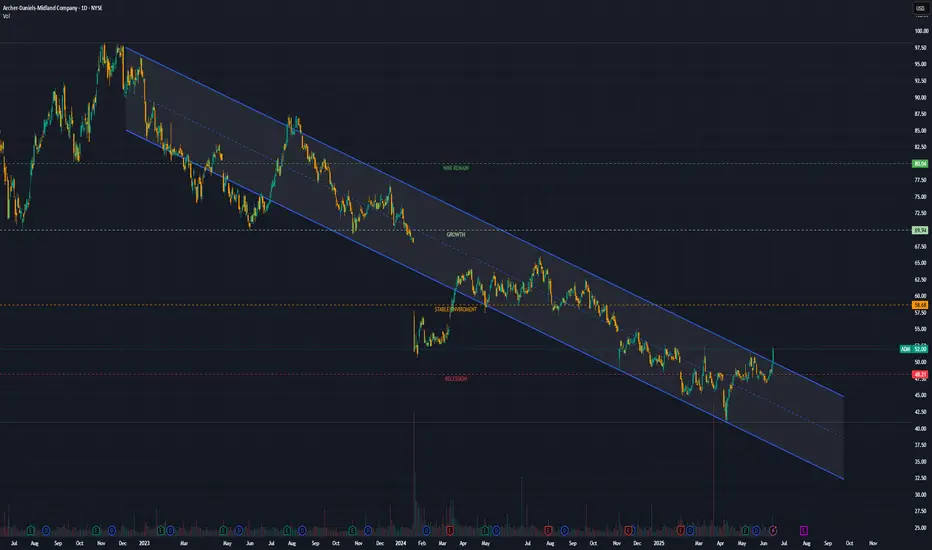
ADM 1D: 10-Month Channel Says Goodbye?Since July 18, 2024, ADM had been locked in a clean downward channel — well-behaved, well-respected. But in May 2025, the structure finally cracked: price broke out, crossed above the 50-day MA, and pulled back for a textbook retest right on the channel’s upper edge. So far, the breakout is holding.

ADM | Inverse Head & Shoulders + Parallel Channel = Reversal📍 Ticker: NYSE:ADM (Archer-Daniels-Midland Company)
📆 Timeframe: 1D (Daily)
📉 Price: $48.74
📊 Volume: 2.82M
📈 RSI: 54.80 (Momentum building)
🔍 Technical Setup:
NYSE:ADM is completing a textbook Inverse Head & Shoulders at the bottom of a rising channel, hinting at a structural reversal.
🟢 Gree

ADM Closing In!!ADM is closing in on $37.xx. This is my buy zone. With a long term up trend and a break out 4 years ago. Price pulling back to pre covid levels is a huge opportunity. This is Longterm trade hoping to get a tp target as it approaches the resistance trend line. Stay patient for $37 levels sit back and


ADM dropping into the buy zone!ADM is a long standing Fortune 500 company and been around since 1902. ADM has been a back bone company in Americas young history. Although RFK is coming for the seed oils, ADM is and will always will be a big dog in American agriculture. Also important to add that commodity prices have collapsed th

$ADM for a 25%+ profitRSI is in the buy zone. PE and PB are in a beautiful buy range too. Sell at the red line.

ADM to $50My trading plan is very simple.
I buy or sell when price tags the top or bottom of parallel channels.
I confirm when price hits Fibonacci levels.
So...
Here's why I'm picking this symbol to do the thing.
Price in channel zones at bottom of channels (period 100 52 & 26)
Stochastic Momentum Ind

ADM ...Archer-Daniels-Midland big boy in foodsSo the TSLA graph I just posted a bit ago doesn't flow like this one does in regards to cash flow and stock movements.
It follows pretty well and gives you a good idea that agriculture is the place to be in coming months/year max. There is an idea that follows:
You don't support those who actuall

ADM Lower?Might take forever, but its coming down to the box at some point. Will load up huge in the box.

See all ideas
Summarizing what the indicators are suggesting.
Neutral
SellBuy
Strong sellStrong buy
Strong sellSellNeutralBuyStrong buy
Neutral
SellBuy
Strong sellStrong buy
Strong sellSellNeutralBuyStrong buy
Neutral
SellBuy
Strong sellStrong buy
Strong sellSellNeutralBuyStrong buy
An aggregate view of professional's ratings.
Neutral
SellBuy
Strong sellStrong buy
Strong sellSellNeutralBuyStrong buy
Neutral
SellBuy
Strong sellStrong buy
Strong sellSellNeutralBuyStrong buy
Neutral
SellBuy
Strong sellStrong buy
Strong sellSellNeutralBuyStrong buy
Displays a symbol's price movements over previous years to identify recurring trends.
US39482AC8
ARCH.DANIELS 21/51Yield to maturity
7.03%
Maturity date
Sep 15, 2051
ADM4540771
Archer-Daniels-Midland Company 3.75% 15-SEP-2047Yield to maturity
6.44%
Maturity date
Sep 15, 2047
ADM.GJ
Archer-Daniels-Midland Company 6.95% 15-DEC-2097Yield to maturity
6.12%
Maturity date
Dec 15, 2097
ADM4773867
Archer-Daniels-Midland Company 4.5% 15-MAR-2049Yield to maturity
6.09%
Maturity date
Mar 15, 2049
ADM3963760
Archer-Daniels-Midland Company 4.016% 16-APR-2043Yield to maturity
6.05%
Maturity date
Apr 16, 2043
ADM3827213
Archer-Daniels-Midland Company 4.535% 26-MAR-2042Yield to maturity
5.92%
Maturity date
Mar 26, 2042
ADM.GW
Archer-Daniels-Midland Company 5.765% 01-MAR-2041Yield to maturity
5.44%
Maturity date
Mar 1, 2041
ADM.GS
Archer-Daniels-Midland Company 6.45% 15-JAN-2038Yield to maturity
5.35%
Maturity date
Jan 15, 2038
ADMA
ARCH.DANIELS 22/32Yield to maturity
4.91%
Maturity date
Mar 1, 2032
ADM.GP
Archer-Daniels-Midland Company 5.375% 15-SEP-2035Yield to maturity
4.89%
Maturity date
Sep 15, 2035
ADM5564429
Archer-Daniels-Midland Company 4.5% 15-AUG-2033Yield to maturity
4.89%
Maturity date
Aug 15, 2033
See all ARDA bonds
Curated watchlists where ARDA is featured.


Frequently Asked Questions
The current price of ARDA is 46.905 EUR — it has decreased by −0.26% in the past 24 hours. Watch ARCHER-DANIELS-MIDLAND CO stock price performance more closely on the chart.
Depending on the exchange, the stock ticker may vary. For instance, on VIE exchange ARCHER-DANIELS-MIDLAND CO stocks are traded under the ticker ARDA.
ARDA stock has risen by 0.67% compared to the previous week, the month change is a −0.92% fall, over the last year ARCHER-DANIELS-MIDLAND CO has showed a −20.57% decrease.
We've gathered analysts' opinions on ARCHER-DANIELS-MIDLAND CO future price: according to them, ARDA price has a max estimate of 51.32 EUR and a min estimate of 38.49 EUR. Watch ARDA chart and read a more detailed ARCHER-DANIELS-MIDLAND CO stock forecast: see what analysts think of ARCHER-DANIELS-MIDLAND CO and suggest that you do with its stocks.
ARDA reached its all-time high on Nov 3, 2022 with the price of 99.420 EUR, and its all-time low was 27.675 EUR and was reached on Mar 23, 2020. View more price dynamics on ARDA chart.
See other stocks reaching their highest and lowest prices.
See other stocks reaching their highest and lowest prices.
ARDA stock is 1.37% volatile and has beta coefficient of 0.41. Track ARCHER-DANIELS-MIDLAND CO stock price on the chart and check out the list of the most volatile stocks — is ARCHER-DANIELS-MIDLAND CO there?
Today ARCHER-DANIELS-MIDLAND CO has the market capitalization of 22.25 B, it has decreased by −1.78% over the last week.
Yes, you can track ARCHER-DANIELS-MIDLAND CO financials in yearly and quarterly reports right on TradingView.
ARCHER-DANIELS-MIDLAND CO is going to release the next earnings report on Jul 29, 2025. Keep track of upcoming events with our Earnings Calendar.
ARDA earnings for the last quarter are 0.65 EUR per share, whereas the estimation was 0.61 EUR resulting in a 5.54% surprise. The estimated earnings for the next quarter are 0.72 EUR per share. See more details about ARCHER-DANIELS-MIDLAND CO earnings.
ARCHER-DANIELS-MIDLAND CO revenue for the last quarter amounts to 18.65 B EUR, despite the estimated figure of 20.41 B EUR. In the next quarter, revenue is expected to reach 18.52 B EUR.
ARDA net income for the last quarter is 272.68 M EUR, while the quarter before that showed 547.71 M EUR of net income which accounts for −50.21% change. Track more ARCHER-DANIELS-MIDLAND CO financial stats to get the full picture.
Yes, ARDA dividends are paid quarterly. The last dividend per share was 0.45 EUR. As of today, Dividend Yield (TTM)% is 3.73%. Tracking ARCHER-DANIELS-MIDLAND CO dividends might help you take more informed decisions.
ARCHER-DANIELS-MIDLAND CO dividend yield was 3.96% in 2024, and payout ratio reached 54.78%. The year before the numbers were 2.49% and 28.01% correspondingly. See high-dividend stocks and find more opportunities for your portfolio.
As of Jul 22, 2025, the company has 44.04 K employees. See our rating of the largest employees — is ARCHER-DANIELS-MIDLAND CO on this list?
EBITDA measures a company's operating performance, its growth signifies an improvement in the efficiency of a company. ARCHER-DANIELS-MIDLAND CO EBITDA is 2.58 B EUR, and current EBITDA margin is 3.92%. See more stats in ARCHER-DANIELS-MIDLAND CO financial statements.
Like other stocks, ARDA shares are traded on stock exchanges, e.g. Nasdaq, Nyse, Euronext, and the easiest way to buy them is through an online stock broker. To do this, you need to open an account and follow a broker's procedures, then start trading. You can trade ARCHER-DANIELS-MIDLAND CO stock right from TradingView charts — choose your broker and connect to your account.
Investing in stocks requires a comprehensive research: you should carefully study all the available data, e.g. company's financials, related news, and its technical analysis. So ARCHER-DANIELS-MIDLAND CO technincal analysis shows the buy rating today, and its 1 week rating is neutral. Since market conditions are prone to changes, it's worth looking a bit further into the future — according to the 1 month rating ARCHER-DANIELS-MIDLAND CO stock shows the sell signal. See more of ARCHER-DANIELS-MIDLAND CO technicals for a more comprehensive analysis.
If you're still not sure, try looking for inspiration in our curated watchlists.
If you're still not sure, try looking for inspiration in our curated watchlists.