Angle of Ascent: what it means, how to use it.Angle of Ascent is a visual pattern that forms on a chart when stocks are running with momentum or velocity. Drawing a line along an up trending price action helps you see the Angle of ascent. Also Chaikins Osc and EMA MFI indicators are extremely helpful in warning a day ahead of time that the Angle of Ascent is too steep to sustain.
This is an exit signal for profit taking at or near the highest high of a swing style run.
Angle of Ascent is also used on Weekly Charts to determine how far a stock can run before resistance from previous highs will stall that stock and cause a minor to intermediate correction.
Recognizing when an angle of ascent has become too steep to sustain and using these indicators will help you hold a swing run but also help you exit before a retracement or correction starts.
The professional side of the market uses penny spreads, millisecond routing to the ques of the market, and can easily front run retail traders orders.
Reminder: retail brokers are required to light your order before sending to the PFOF Payment for Order Flow Market Maker of their choice.
The Digital Stock Market moves at a much faster pace with subtle nuances such as Angle of Ascent. As you become an advanced level trader to a semi-professional trader, or potentially a full time professional trader, these details matter more than when you are just learning stock trading.
Trade Wisely
Martha Stokes CMT
CAT trade ideas

CAT watch $308 above 302 below: Major fibs define range to breakCAT just released Earnings report with small "miss".
Price oscillating between major fibs $301.97-308.82
If Bull, look for a pop to tight zone $325.49-326.16

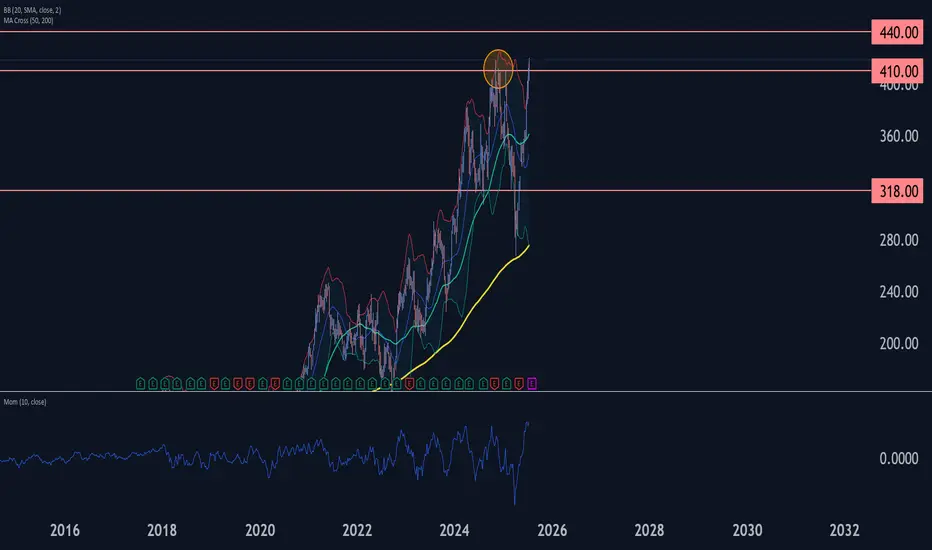
Caterpillar Wave Analysis – 17 July 2025
- Caterpillar broke long-term resistance level 410.00
- Likely to rise to resistance level 440.00
Caterpillar recently broke above the major long-term resistance level 410.00, which has been reversing the price from the end of 2024, as can be seen from the weekly Caterpillar chart below.
The breakout of the resistance level 410.00 accelerated the active intermediate impulse wave (C) from the middle of 2025.
Given the overriding weekly uptrend and the accelerating weekly Momentum, Caterpillar can be expected to rise to the next resistance level 440.00 (target for the completion of the active intermediate impulse wave (C)).
$CAT Tradespoon – Long Entry $404.54Tradespoon model generated long signal for NYSE:CAT . Predicted range: $404.54–$412.44. Trend: +0.38%. NYSE:CAT
Caterpillar's Bullish Momentum Points to Extended GainsCurrent Price: $397.86
Direction: LONG
Targets:
- T1 = $407.80
- T2 = $415.75
Stop Levels:
- S1 = $390.50
- S2 = $384.00
**Wisdom of Professional Traders:**
This analysis synthesizes insights from thousands of professional traders and market experts, leveraging collective intelligence to identify high-probability trade setups. The wisdom of crowds principle suggests that aggregated market perspectives from experienced professionals often outperform individual forecasts, reducing cognitive biases and highlighting consensus opportunities in Caterpillar.
**Key Insights:**
Caterpillar continues to benefit from strong tailwinds in global infrastructure investments, particularly in developed nations seeking economic revitalization through construction and public works projects. The company's focus on innovating within heavy machinery, including more environmentally sustainable equipment, enhances its long-term appeal and positions it well against industry competitors. Additionally, technical signals show that the asset remains steadily above key support levels, reinforcing the bullish outlook.
**Recent Performance:**
Caterpillar has demonstrated consistent resilience, outperforming broader market indices in recent weeks. The stock price has increased by approximately 6% in the last month, driven by robust quarterly earnings and positive forward guidance. This indicates healthy investor sentiment and confidence in Caterpillar's ability to navigate current market conditions, including inflationary pressures and energy price fluctuations.
**Expert Analysis:**
Industry analysts continue to assign high price targets for Caterpillar, citing its leadership in the heavy equipment and machinery sector as a significant competitive advantage. The diversification of its product line and its ability to capture market share in emerging markets bolsters its projected growth. Caterpillar's commitment to innovation in both machinery and operational efficiency has attracted long-term investors, solidifying the stock as a popular pick for capital appreciation.
**News Impact:**
Recent announcements regarding Caterpillar's expansion efforts into emerging markets and increased government contracts for infrastructure-related equipment have ignited optimism among investors. Additionally, favorable macroeconomic developments, such as global spending on infrastructure projects, have acted as a tailwind, further amplifying expectations of continued strong performance.
**Trading Recommendation:**
Given its resilience, favorable macroeconomic setup, and technical strength, Caterpillar offers an attractive opportunity for long positions. Investors should consider the outlined targets and stops for entry points, keeping in mind the ongoing positive sentiment and bullish factors driving the asset forward. This trade setup provides a high-probability scenario to capture extended gains in the heavy machinery sector.

Caterpillar: Key Levels to Watch Amid Infrastructure BoomCurrent Price: $384.71
Direction: LONG
Targets:
- T1 = $395.00
- T2 = $408.00
Stop Levels:
- S1 = $374.00
- S2 = $366.00
**Wisdom of Professional Traders:**
This analysis synthesizes insights from thousands of professional traders and market experts, leveraging collective intelligence to identify high-probability trade setups. The wisdom of crowds principle suggests that aggregated market perspectives from experienced professionals often outperform individual forecasts, reducing cognitive biases and highlighting consensus opportunities in Caterpillar.
**Key Insights:**
Caterpillar’s performance continues to be bolstered by strong demand in the industrial machinery sector, specifically construction and mining equipment. Recent earnings reports demonstrate solid growth in revenues driven by global infrastructure spending. The company's strategic initiatives in supply chain resilience and decentralized manufacturing have helped maintain cost efficiency even amidst macroeconomic uncertainties. Favorable global trends in infrastructure spending, particularly emerging markets, provide room for further appreciation in Caterpillar’s share price.
On the technical side, Caterpillar’s charts exhibit signs of bullish momentum, supported by positive RSI and MACD signals. The current resistance level near $390 is critical — a breakout above this could pave the way for significant upside. Buyers appear to hold the advantage as institutional investments into industrial sectors remain steady.
**Recent Performance:**
Caterpillar has shown notable resilience over recent months, trading consistently higher amidst broader market volatility. The stock consolidated around the $380-$385 range, reflecting investor confidence in its operational capabilities during uncertain periods. A 3.2% gain last quarter showcases Caterpillar's ability to capitalize on global investment trends favoring construction and energy-related industries.
**Expert Analysis:**
Professional analysts remain bullish on Caterpillar, citing its unmatched leadership position within the industrial sector and intelligent capital allocation strategies. Supply chain improvements have further boosted production efficiency, enabling the firm to meet increased demand for its equipment. While geopolitical tensions and fluctuating commodity prices raise concerns, Caterpillar’s strategic hedging positions mitigate some of these risks effectively. Analysts predict further upside potential, especially should infrastructure growth maintain its current pace.
**News Impact:**
The global infrastructure boom, fueled by government spending initiatives in North America and Asia, has fortified Caterpillar’s order backlog. Additionally, growing interest in renewable energy projects and private investments into mining operations signal further tailwinds for Caterpillar's machinery sales. Recent positive data on construction activity in the U.S. aligns well with Caterpillar’s growth outlook, adding confidence to the stock's bullish trajectory.
**Trading Recommendation:**
Caterpillar offers a compelling long setup for bullish traders seeking industrial sector exposure. Its strategic expansion alongside robust demand fundamentals positions it well ahead of its competitors. With targets set at $395 and $408, investors can capitalize on potential breakouts while safeguarding positions using stops at $374 and $366. While geopolitical and macroeconomic risks remain watchpoints, Caterpillar’s technical and fundamental framework bolsters its upward trajectory as infrastructure investments pick up steam globally.

Caterpillar: Countertrend ActionCaterpillar’s green wave has further room to run. However, this rise represents only an internal countertrend – the broader correction in beige wave IV is still ongoing. Under our primary scenario, we expect the price to form another low before launching into a sustained advance, which should ultimately push above resistance at $409.40. Meanwhile, our alternative scenario—carrying a 38% probability—suggests that beige wave alt.IV has already bottomed. If that’s the case, the correction is complete, and a direct breakout above $409.40 could follow.
📈 Over 190 precise analyses, clear entry points, and defined Target Zones - that's what we do.

CAT TRADE IDEA – HEAVY EQUIPMENT, HEAVY POTENTIAL 📈🏗️🐾Sector: Industrials – Construction & Machinery
When the giants sleep, we prepare. And when they wake, we ride the momentum.
Caterpillar has been consolidating, and the recent pullback opens the door for a high-conviction setup. I'm looking to build my position in 3 strategic zones — scaling in with patience, letting the market give me the setup on my terms.
🟢 Entry Plan (Scaling In):
⚙️270 – First nibble as it approaches key structural support
⚙️250 – Historical support level and psychological round number
⚙️215 – Panic zone entry — if it hits here, it's a gift 🧨
🎯 Profit Targets:
320 – Swing back to resistance; first trim zone
370 – Momentum continuation with strong industrial tailwinds
400 – Full send 🚀 Long-term target if infrastructure demand and global growth trends align
🛡️ Risk Strategy:
Staggered entries allow for cost basis control
Adjust position sizing based on entry zone reached
💡 Why CAT?
Caterpillar’s fundamentals remain strong with global infrastructure spending on the rise, and the stock is approaching historical discount levels. This setup is about anticipating the bounce, not chasing it. Plan the trade, trade the plan.
📢 DISCLAIMER:
This is not financial advice. I'm sharing my personal trade plan for educational purposes only. Always do your own research and consult a licensed financial advisor before making any investment decisions. Trading involves real risk — respect it.

CAT Weekly Bullish Trend is startingThe presence of a harmonic pattern alongside a positive divergence and an important support level can be a good indication of the start of an uptrend in Caterpillar.


Caterpillar: Progress!Caterpillar has successfully fallen below the $318.68 level, marking an important step in our primary scenario. There is a 32% probability that we have already seen the low of wave alt.IV in beige, which would allow the price to move directly above the resistance at $386.48 from here. However, due to the price structure, we assume that the regular wave IV in beige still requires a new low before the next rise is scheduled. Once this important bottom of wave IV is found, there is ample potential on the upside.

CAT looks bearish hereAs said in the title and shown in the chart, breaking down out of a rising wedge usually ends in a correction. So to keep things easy, for now I'm looking at a correction based on a simple Fib level.

Caterpillar Wave Analysis – 2 April 2025
- Caterpillar reversed from the support area
- Likely to rise to the resistance level 350.00
Caterpillar recently reversed up from the support area between the key support level 318.00 (which has been reversing the price from the start of 2024), lower weekly Bollinger Band and the 50% Fibonacci correction of the upward impulse from August.
The upward reversal from this support area stopped the earlier impulse wave C of the weekly ABC correction (4) from last year.
Given the clear weekly uptrend, Caterpillar can be expected to rise to the next resistance level 350.00.

CAT eyes on $325: semi-major Support that could paint a bottom CAT has been in a waterfall along with the market.
Now at a semi-major support that just might hold.
$325.49-326.16 is the exact zone of concern for bulls.
===============================================
.

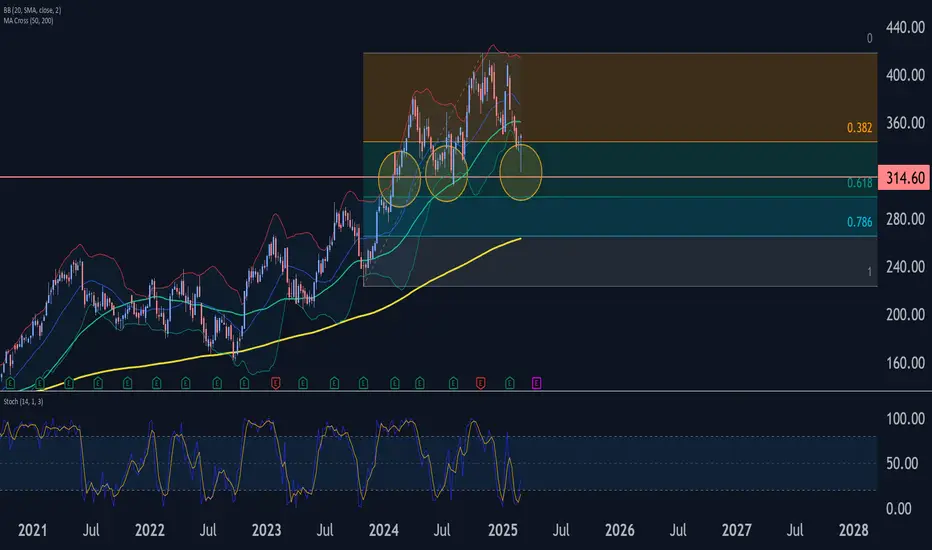
CAT Wave Analysis – 7 March 2025
- CAT reversed from the support area
- Likely to rise to the resistance level 360.00
CAT recently reversed from the powerful support area between the key support level 314.60 (which has been reversing the price from last year), lower weekly Bollinger Band and the 50% Fibonacci correction of the upward impulse from the end of 2023.
The upward reversal from this support zone is set to form the weekly Japanese candlesticks reversal pattern Hammer this week (strong buy signal for CAT).
Given the weekly daily uptrend and still oversold weekly Stochastic, CAT can be expected to rise further to the next resistance level 360.00.
Reversal on Caterpillar. CATA very flat AB=CD, ABCDE retrace on impulse contained within. Now, in OBOS territory, but fairly convincing candle crossing vWAP/US duo. My guess is that was a triple drive contained within AB=CD structure. Another note, the ABBCDE forms an expanding triangle structure, and any triangle is more likely to break out on the flat side. The top side is more flat in this case. Given the deep retrace, I don't expect a spectacular breakout if it even happens.

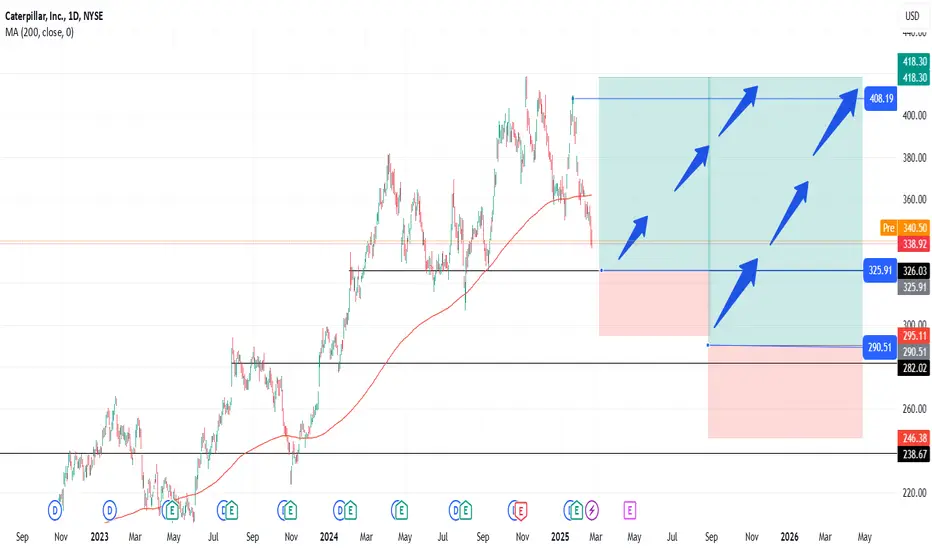
CAT Trade Plan OverviewBelow is an example of a structured trade plan for CAT using the provided entry and profit levels. This plan uses a scaling-in approach to manage risk and average down the cost basis while planning for profit-taking at multiple targets.
Entry Strategy
330: Initial entry level
325: Add on a slight pullback
300: Build additional positions as the price declines further
290: Final accumulation level if the downtrend continues
This approach allows you to average into the position gradually, potentially lowering your overall entry cost if the price dips.
Profit Targets
350: First profit target, useful for locking in early gains
380: Second target, capturing a larger rebound move
410: Third, more ambitious target for extended upside
Setting multiple profit targets can help secure profits progressively while leaving room for further gains if the trend continues.
Disclosure
The information provided here is for educational and informational purposes only and does not constitute financial or investment advice. Trading involves substantial risk, including the risk of loss. You should conduct your own research or consult with a licensed financial advisor before making any trading decisions.
Happy trading, and always manage your risk carefully!
9 Lives?NYSE:CAT has gotten hammered (down 16% in a month). Although this is a mix of earnings and tariff fears, I believe the C wave has been completed from a technicals perspective as this is now in oversold territory.

HIMS: BUY NOW OR FOMO LATER📈 Unlock the Secrets of $HIMS! 📈
Join me as I take you through an in-depth analysis of NYSE:HIMS , covering both fundamentals and technical analysis.
🔍 Charts Breakdown:
Massive multi-year cup and handle breakout 🏆
💡 Fundamentals with H5 Investing Strategy:
A comprehensive look at why NYSE:HIMS is a massive buy 📈
Fair value based on a DCF model: $52 💰
Let's dive deep into the numbers and uncover why NYSE:HIMS is a game-changer!

Preparing for a bullish come backNYSE:CAT is looking at a potential rebound after strong price action is showing some bullish action in the midst.
Price action
The stock has broken out of the immediate over resistance after rebounding off the key 138.2% extension level of the previous diamond top pattern. Furthermore, there is a strong double test of the key support zone at 354-365 region.
Momentum
Long-term MACD's histogram remain negative, which is one of the key risk. However, mid-term stochastic Oscillator (62, 12, 12) is eyeing a potential oversold crossover.
The rate of change is still below the zero line but it has rebound from the bottom.
Volume is healthy. DM+ is sloping up, eyeing potential return of a bullish strength.
Potential Risk:
Most of the major momentum indicator have yet to be confirmed. However, long-term trend remain bullish since 2008. Furthermore, price action is bullish. But we scale in with lower lot sizes and leave the rest at 340 or 324 support for a rebound.

CAT: Will be a beneficiary of disastersNYSE:CAT - SWING TRADE:
Sadly after the flooding in NC, the fires in CA, and hurricanes a lot needs rebuilt. Leading to CAT to profit from the destruction. Also, pullback and recession proof for the most part. Safe swing that could turn into a long play.
-Falling Wedge breakout
-Green H5 Indicator about to cross through smoothing line
-Volume shelf launch
-Wr% running into red barrier, will wait for that to peel off and stay in until H5 indicator or WCB breaks after it creates support.
3 SOLID PROFIT TARGETS!
Not financial advice

More Downside in Caterpillar?Caterpillar fell sharply last month, and some traders may see further downside risk.
The first pattern on today’s chart is the gap on November 6 after Donald Trump won the U.S. Presidential election. The industrial stock failed to hold that breakout and soon found itself at levels from September. Have buyers disappeared?
Second is the price zone on either side of $360. It’s near last summer’s highs and the 200-day simple moving average. A close under it may signal a breakdown.
Third, the recent series of lower highs may be consistent with bearish continuation.
Next, CAT dropped on October 30 after earnings and revenue missed estimates. That may suggest fundamentals are weakening.
Finally, our 2 MA Ratio custom script in the lower study shows the 8-day exponential moving average (EMA) has been under the 21-day EMA. That could be further evidence of a bearish trend.
TradeStation has, for decades, advanced the trading industry, providing access to stocks, options and futures. If you're born to trade, we could be for you. See our Overview for more.
Past performance, whether actual or indicated by historical tests of strategies, is no guarantee of future performance or success. There is a possibility that you may sustain a loss equal to or greater than your entire investment regardless of which asset class you trade (equities, options or futures); therefore, you should not invest or risk money that you cannot afford to lose. Online trading is not suitable for all investors. View the document titled Characteristics and Risks of Standardized Options at www.TradeStation.com . Before trading any asset class, customers must read the relevant risk disclosure statements on www.TradeStation.com . System access and trade placement and execution may be delayed or fail due to market volatility and volume, quote delays, system and software errors, Internet traffic, outages and other factors.
Securities and futures trading is offered to self-directed customers by TradeStation Securities, Inc., a broker-dealer registered with the Securities and Exchange Commission and a futures commission merchant licensed with the Commodity Futures Trading Commission). TradeStation Securities is a member of the Financial Industry Regulatory Authority, the National Futures Association, and a number of exchanges.
TradeStation Securities, Inc. and TradeStation Technologies, Inc. are each wholly owned subsidiaries of TradeStation Group, Inc., both operating, and providing products and services, under the TradeStation brand and trademark. When applying for, or purchasing, accounts, subscriptions, products and services, it is important that you know which company you will be dealing with. Visit www.TradeStation.com for further important information explaining what this means.

A classic break-n-retest on CAT!🔉Sound on!🔉
📣Make sure to watch fullscreen!📣
Thank you as always for watching my videos. I hope that you learned something very educational! Please feel free to like, share, and comment on this post. Remember only risk what you are willing to lose. Trading is very risky but it can change your life!
