CDE trade ideas
SCAM idea from borker??Apparently I received a call from a broker today who insited on me buying this CDE stock at 3.48 USD (price they expect to get during today's session).
This company is supposed to have just signed an important contract that will make the price go to 5 or even 6 USD within 3 months. Maximum loss they expect is 15%.
Apparently more than 30 analysts from this company agreed that the stock can only go up. No doubts.
The whole thing sounded so much like The Wolf of Wall Street movie so I just decided to listen to what he had to say for fun. I would never put money over the phone under these circumstances so I decided to test his idea here instead.
Profit 1 at 5.00 USD
Profit 2 at 6.00 USD
Stop Loss at 2.95
Deadline: 3 months
Let's see how bad of a scam it was!
CDE - attractive entryNYSE:CDE is one of the most volatile ideas in the gold mining space. So if enetered correctly it offers relatively quick and attractive rewards.
Currently idea is retesting major support level, through which it broken up in early November. And if uptrend is to continue in this miner, should not go much lower than current spot.
I am entering with idea to hold it as potential long term holding.
CDE Lotto TicketCDE is one of my lotto tickets for a possible 10-bagger. Even with the recent 60% surge this summer it’s still down about 90% from its post-recession/QE surge. As with EXK (and almost all miners, especially juniors), it’s undergoing a healthy backfill after an amazing run.
Plan:
Price is already below the 50 SMA on the daily with the average still pointing up. Too easy. Waiting for price to close above the 50 SMA and RSI 9 EMA to cross the mid line (set levels to 50 instead of 80/20) for a signal. Confirmation will be price exceeding the signal candle. Stop loss @1.5x ATR.
Not financial advice. Will update when active.
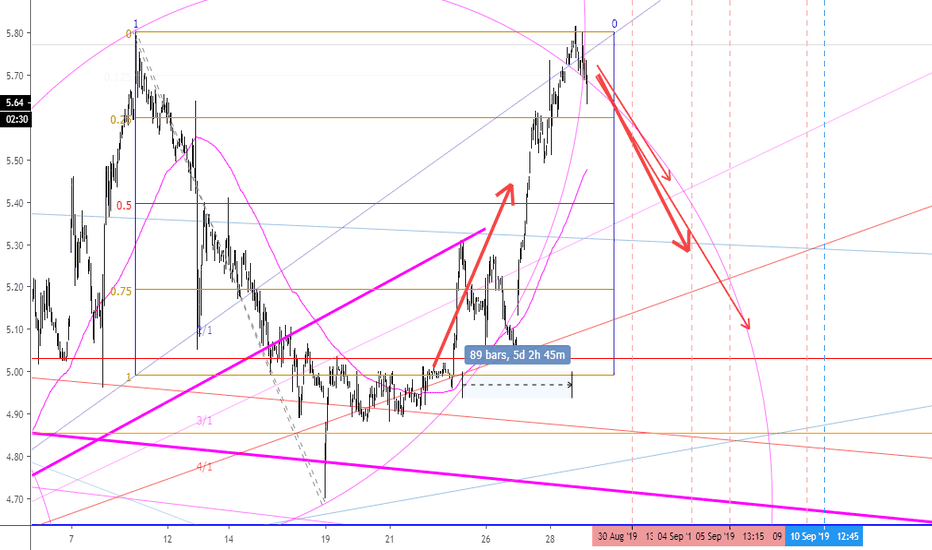
Coeur Mining Inc (CDE) ShortI really like this chart. I am not showing you quite everything, but you can see some fine equality between time and price here as well as fibonacci time bars in agreement. Many times I use the arcs as timing arcs, but here, use the arcs as support and resistance. Vertical lines however are in fact timing lines for mini reversal points (trading point) calculated by squaring the range. With the high in, and a double top, indicators agree that we are due for some downside price movement and momentum. Also, with this one, I was able to time the bottom perfectly for a 10% move to the upside., so have trust in the arcs and the equality of price and time.
Happy trading!
Best
NYSE:CDE
CDE - move to 4$ in playYesterday NYSE:CDE broke through bearish flag and is now targeting region at around 4$, based on the symmetry and current chart structure. There it should find strong support, for the move higher.
Potrential trade: Sell short @ 4.60-4.70 region
Target: 4-4.15
S top-loss: 4.90
Risk/reward: 2 to 1 or 3 to 1 based on the entries, which is reasonable.
LONG CDE - Company just broke out of a 8 year down trendCDE is a great buy here as the stock has broken out of a 8 year down trend starting in 2011. CDE has lagged other silver miners slightly during these recent silver breakout ().
They are optimizing recovery and costs at current claims and have a great deal of exploration and potential for new claims in the works. They have suffered from aggressive short selling as of late - see: fintel.io , but this should just fuel a spike in the stock as Silver moves to its next resistance point of $17.30. Technically resistance at $5.20, then $5.75.
CDE The SMF strategy forecast indicates a setup on the following pairing;
Stock : CDE Coeur Mining Inc
Sector : Basic Material
Insdustry : Precious Metal & Minerals
Term : Short
Rick : Medium
Exchange : Cboe BZX
SMF strategy would be to Buy :
Between : $4.45 - $4.55
SMF strategy would be to Sell at :
Short term
Target 1 : $4.8 (5% Profit)
Target 2 : $4.9 (7% Profit)
Target 3 : $5.05 (11% Profit)
Medium term
Target 1 : $5.05 (11% Profit)
Target 2 : $5.3 (16% Profit)
Target 3 : $5.5 (21% Profit)
SMF strategy would be to set a stop loss at :
Stop Loss: $4.10
Trader Comments on the forcasted setup:
EMA and MA 200 act like support. The 100 follow behind
The VPVR let a lot of space to reach the targets. The POC act like a support around the price of 4.16$
Thanks for liking and comment this post!
CDE (Coeur Mining) breaking out? Silver lagging.It looks like silver stock CDE NYSE:CDE is breaking out, with first target at 7.
I like how the A/D (Advance/Decline is curling upwards quickly now.
CDE's breakout might be confirmed by other silver stocks like First Majestic Silver NYSE:AG .
Silver FX_IDC:XAGUSD itself is still lagging a tad to most silver stocks and gold FOREXCOM:XAUUSD , but with the US$ likely to loose some strength, that should only be a matter of time before it pops upward as well.
rise of the silver surfersilver based on the gold silver ratio is at a discount not seen since the 1990's. the bearish divergence within the ratio indicates
metals traders are be are beginning to flow into or swap gold into silver. since the spread is at an unusual dissonance
silver miners may have an extended exposure to the net flows. cde hits most if not all the check boxes i look for valuation wise.
technicals indicate a major breakout may occur in this low float silver play.


