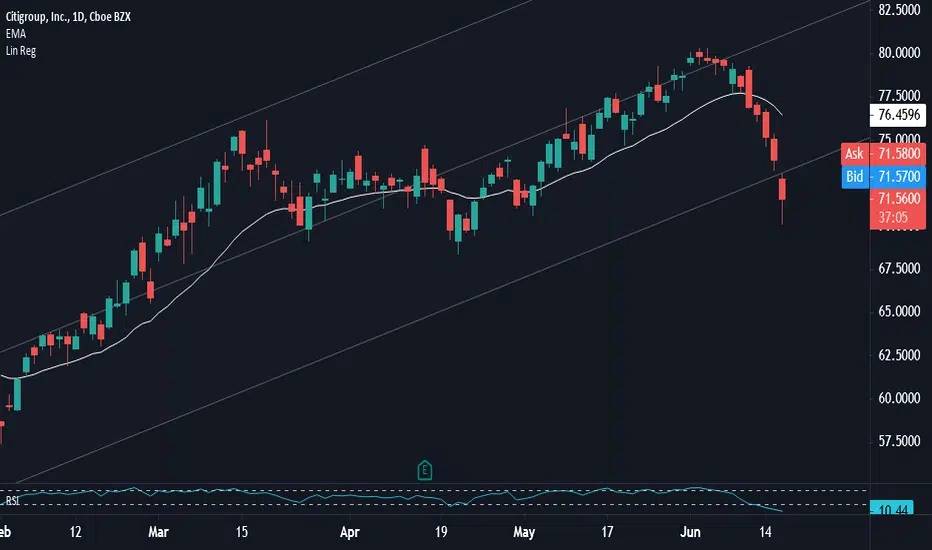
UPDATE, CITI “C” Drop still EASY MONEY!Just providing update
Pullbacks were expected as “bulls” hold strong positions of course pullback and price action “insecurity” is to be shown...
Looking at the pattern now formation is down a drop is EXPECTED!
Even the channel in itself actually forming that downward motion is in position to drop and reach a level of support...
Drop STRONGLY expected!
CITI trade ideas

C, TIME TO BUY!Hello fellow traders and investors CitiGroup has been experiencing a pullback before their earnings report that was released today. They beat EPS expectations by 45% and also slightly beat revenue expectations as well. Citigroup offers a 16% ROI if it recovers to the take-profit area.
Entry: ~67.75$
Take Profit: 80$
Stop Loss: ~65.50$
Technicals:
-RSI=Oversold
-Moving averages still indicating a downtrend
Fundamentals:
-Description: Citigroup, Inc. is a holding company, which engages in the provision of financial products and services.
- Market Cap: 138B
- Sales Last 12 Months: 53.50B
- P/E: 9.35
- P/S: 2.58
- Debt/Equity: 2.70
- Sales growth Q/Q: -27%
- EPS growth Q/Q: 240%
- Profit Margin: 28.50%
- Short Float: 1.46%
If you enjoyed the analysis make sure to like and follow for more! Thanks!

$C Bullish Looking for $C to absolutely run within the next week or two... The chart is self-explanatory with supply zones being pushed back into... We shall see..

CitigroupSeems like XLF has been taking a brief dip. with a stochastic under 50% currently 44% I wanted to find a reasonable company that was near or at a support level on the daily, 4 hour, and 1 hour time frames. Citigroup seems like a good deal to me.
The rsi and the mac d both match on those three aforementioned time frames and I was waiting for some bullish candles to indicate a potential retracement to the upside which is why I used a fibonacci tool to retrace up to 61% of the previous high on the daily time frame. I will only purchase 1 share i case of a future crash and will be patient enough to wait a true discount.
What do you think?

“C” ANOTHER QUICK MONEY PLAYWas suppose to post before market open
Quick drop to gain price expected to hit 64.00
A “put” position has been placed...
What makes this position go down the last time prices were this low was 5 months ago there was a pull back 2 weeks back just to come back down to this price I see a bear trap as Citigroup does have a great fundamental base a drop to gain is expected... Happy trading let go at the 64.00 price sense the price of option contracts are so cheap because of the volitilaty of the stock even a .50 cent move calls for a 40% gain

C Bias: UpThe price is currently trading in an descending channel and has broke down a major support, but due to buy volume and small stop loss, we decided to take a buy trade on this one. If you are taking this trade, make sure to apply stop loss to your trade.

$C very bullish/outlook Focusing on the daily here IMO I believe Citigroup ticker $C is absolutely primed for a move up. I am extremely bullish for a rotation back into the financial sector but also from a technical standpoint. As we can see a solid bounce on our higher time frames with lots of sellers getting shaken out. RSI plenty of room to run, focusing on W formations on the relative strength index for further bullish confirmation.... However, as I’ve said, I am extremely bullish on $C and believe that we will see a move up in price within the next 2-4 weeks if not sooner....

Banks correction (Short it) C If you look at the start of this rising wedge you'll see the pattern started around November 2020. The rise came from the Dems winning the election and constant promise of more and more stimulus. The banks, all with the exception of WFC are all showing this correction pattern. after falling out of its wedge june 11th C dropped 15% in a week.
The last 5 trading days Citi looked like it recovered but infact was nothing but a formation of a bear flag (White lines) which will lead to another 15% drop with my target for cover being 60.39

mastering elliot waves. positive progress. not much else.mostly just mustering the energy to label additional waves beyond m0,m1, and m2. Feel like I have had one or both feet in the grave this past week. Ok, enough with the relaxing thoughts.
I was going to say that this wave falls under rule 1 condition a... but I was trying to do this from memory, and I'm not that confident in what the logical extensions of rule 1 condition a are. I think I'm supposed to label m1 with ":5", but I don't know what that label means besides it's part of an impulse pattern, and I'm not sure which pivot of m1 that ":5" goes on. I can see that it's an impulse without doing a lot of measuring, so I'm kind of getting impatient to understand what all the measuring is about.
I can say that I'm further along today than yesterday, and I'm going to have to learn to be ok with that at least until I get some energy back. I'm feeling like typing on my computer adds 0 value to my life, and debatably subtracts from it.

$C looking like a good buy here.$C has been getting beat down like all the other banks have over the last week or two and I think its time they bounce. Chart shows a decent support around $67.67 and we have Fed Bank Stress Test Results coming up on JUNE 24th which would allow for banks to increase / reintroduce dividends and also start stock buybacks again if they are cleared. I think this could be a big bullish move for banks and the R/R for me is looking nice. RSI also beat down heavily on the daily timeframe and $C doesn't stay oversold for long without a bounce.
I ENTERED 9/17/2021 $82.5 Calls today for 0.45 to be transparent with everyone. I want to see this thing back up towards $80 but I will be scaling out profits on the way up and my stops are tight under $67.67 until I make my contracts free then I will let them run.
FEEL FREE TO ENTER CLOSER TO THE MONEY AND SET UP YOUR OWN TRADE PLAN FOR THIS IF YOU LIKE IT.
SL: Under $67.67
REMEMBER NEVER ALL IN YOLO ON TRADES AND NEVER JUST HOLD AND HOPE SOMETHING WORKS OUT! HAVE A PLAN, TRADE YOUR PLAN, AND IF IT DOESN'T WORK MOVE TO THE NEXT TRADE AND FIND WHAT YOU CAN DO BETTER. TRADING IS A LONG GAME AND NOT JUST A GET RICH QUICK SCHEME.
THIS IS NOT FINANCIAL ADVICE AND I AM ONLY SHARING WHAT I AM DOING AND MY IDEAS!


short term bullI am short term bull on and short on the overall banking industry. Not convinced that the industry as a whole is done bleeding. We could see price hit the 200 SMA before we can see a bounce. its retesting broken support and possibly by end of week or next it will go down. I will be out of my short position if over 72.50. entered one position and adding on at the 70-71 level.


c- oversold/golden pocket bounceBanks got destroyed this week, and may see one more flush to the downside before seeing a bounce. Ideally would like a see a touch to the golden pocket before making a move up, but its so oversold that the bounce may begin this week. How'd I'd it is by scaling into a position with the understanding that $65 is a possibility and be prepared for another entry. Obvious stop would be a loss of the .707 fib retracement.


City Bank in ascending channelCity Bank in ascending channel, entry in the lower edge of tunnel stop loss would be 3% on closing basis, target is 78 where horizontal line is.

Citigroup: Nearing Intraday Target. Take The Money & Run Hit a high of $71.93 (target $72.00). Now around $71.63

Opportunity?Looks like risk off in front of the Fed today. I'm a buyer into this degree of downside extension for a short term bounce play. No real catalyst for the selloff aside from the lower trading revs guide, but I don't think that's a huge deal and was already mostly priced in due to the general slowing market conditions.


Citi LongTrade price: 72.2
Target price: 90
SL: 72
R/R: 1 to 5
Citi is 1 of the banks Stock Picks to benefit from 'Goldilocks Inflation' Cycle... -Source: Wayne Duggan 5/11/2021 Bezinga

C- Citigroup OversoldCC Squeeze is hinting at a trend reversal of the overbought condition.
C has a buy signal on the 30m chart and a buy on the 1hr chart seems to be coming soon.
30m show 4/4 confirmation (trendline, signal, swing, squeeze)
watching 4hr for an entry confirmation to BTO 6/25C @ 76

$C- Citi Bank Breakout to ATH
$C initial breakout needed a retest to find some liquidity before another attempt at breaking an ATH
Bull flag breakout with an Inverse H&S and MacD crossing over bullish. Ride the momentum.
Market rotations keep the market in a strong bull run. Money flows back and forward from Dow components to Nasdaq.
