Citigroup Short July Iron Condor w/ sideways channelCitibank has been trading within a horizontal range and sideways channel between 65.50 and 69 for the past fourteen trading days. Because of this, we are shorting the iron condor by writing the 69 calls and 65.5 puts for the initial strangle, and going half a dollar out on each side to acquire the protection (longing the 69.5 calls and 65 puts), thus turning the strangle into an iron condor. Being slightly below the money, it is somewhat bearish but created such that it aligns with the historical channel. By using the July 5th options, which are eight trading days away, we expect Citi to stay within the channel. This trade is done for a max profit of 30 and a max loss of 20 because the credit is .30/contract. This gives us break-evens of 65.2 and 69.3, and a better risk reward ratio (30/20) is received when the trade is done with calls instead of puts (29/21). This maximizes profit potential.
CITI trade ideas

C BreakoutC is on its 4th test of resistance, with its moving averages kissing up right underneath its price as support. Its also forming a round up pattern within its breakout making it that much more powerful. I'm looking for it to breakout and complete its round up symmetric pattern at $71 for 5% move to the upside.

Daily C(Citi) forecast timing analysis by Supply-Demand strength21-Jun
Investing strategies by pretiming
Investing position about Supply-Demand(S&D) strength: In Rising section of high profit & low risk
Supply-Demand(S&D) strength Trend Analysis: In the midst of an adjustment trend of downward direction box pattern price flow marked by limited rises and downward fluctuations.
Today's S&D strength Flow: Supply-Demand(S&D) strength flow appropriate to the current trend.
View a Forecast Candlestick Shape Analysis of 10 days in the future: www.pretiming.com
(You can easily create a trading plan.)
D+1 Candlestick Color forecast: RED Candlestick
%D+1 Range forecast: 0.3% (HIGH) ~ -1.7% (LOW), -1.0% (CLOSE)
%AVG in case of rising: 1.6% (HIGH) ~ -0.5% (LOW), 1.3% (CLOSE)
%AVG in case of falling: 0.4% (HIGH) ~ -1.5% (LOW), -0.7% (CLOSE)
Price Forecast Timing Criteria: Price forecast timing is analyzed based on pretiming algorithm of Supply-Demand(S&D) strength.
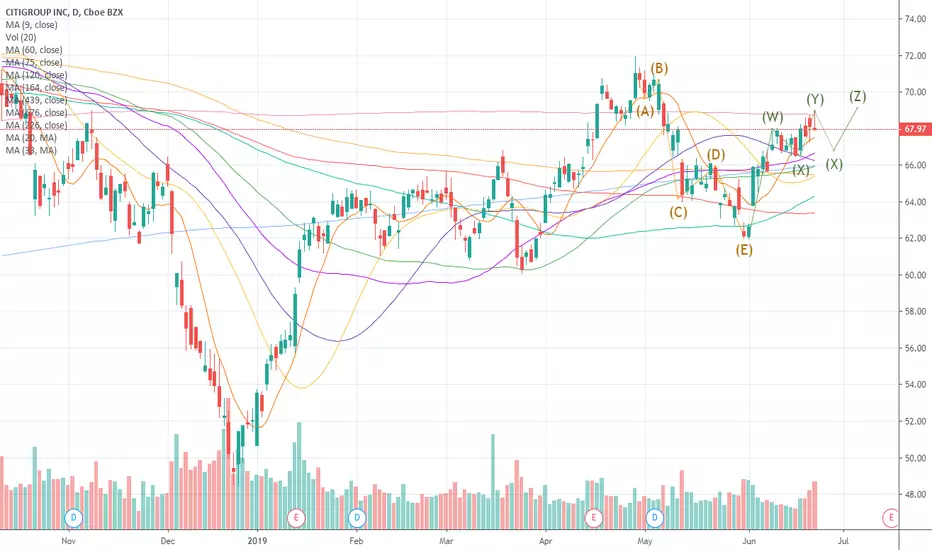
Reversal trade idea10/May/2019 12:48 PM
--
market in interesting conditions rn
so who knows what this will do. And Ive also never been able to do anything right with the financial stocks.
--
but. RR is considerable here if the stock can trade in range here.

C BreakoutC has tested upside resistance over three times and has broken it and closed multiple days over the line on the daily chart. I do think we will see a rotation from tech into financials for the next several weeks. I'm looking for profit potential to $75-$78 for 6-9% gain. If my idea is false I would look to sell at support trend line.


Citigroup, Inc (C)(NYSE) Sell $68.72 >>> Target $67.04NYSE:C
Citigroup, Inc
Stock - NYSE (USA)
Profit:Risk = 1.68:1
---
Sell = $68.72
Take Profit = $67.04
Stop Loss = $69.72
------
Take Profit = +2.44%
Stop Loss = -1.45%


C: Pre-earnings run pattern ahead of Monday reportCitigroup has a pre earnings run pattern which tends to be caused by Pro Traders setting up to take advantage of the earnings reaction. The company will report its 1st quarter earnings on Monday. C had a reactionary gap up at open caused by the JPM gap today. It formed an indecision day candle rapidly. The early gap could interfere with the technical patterns for the report release day.

$C CITIGROUP NOT APPEALING YET. ARE BANKS STILL WHERE YOU SEND MONEY TO DIE ? CITY LIKE MANY ARE STRUGGLING TO GET NEAR THOSE HIGHS FROM 2018. MOST RECENTLY THOUGH THE XLF HAS SEEN A INFLUX OF FRESH CASH, MAYBE GIVING US POSITIVE SIGNALS PRE-EARNINGS. WE WAIT ON THE SIDELINES ON CITIGROUP UNTIL RESISTANCE IS BROKE $67 IS A GOOD ALERT FOR ENTRY IN A LONG.

Breakout imminent With the stock market as bullish as it is “C” should have no problem breaking above resistance. Also, if you notice, 3 weeks ago price tapped resistance and fell hard but in 2 weeks it’s right back at resistance. That’s called manipulation and indicates bullish moves to come

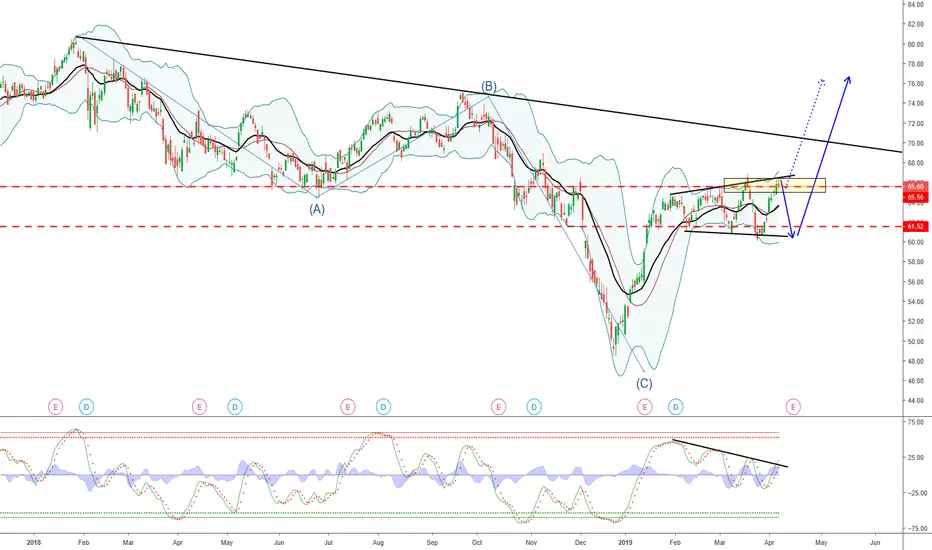
C Citigroup - weekly zoom out C Citigroup - weekly zoom out
Range 55 - 69
resistance test at mean ~ 63
low volume and momentum indicating down trend
VOL ATR - SHORT
macro sentiment unclear
short term neutral, long term bearish idea
next resistance up ~ 69
support at 55 and then down 48

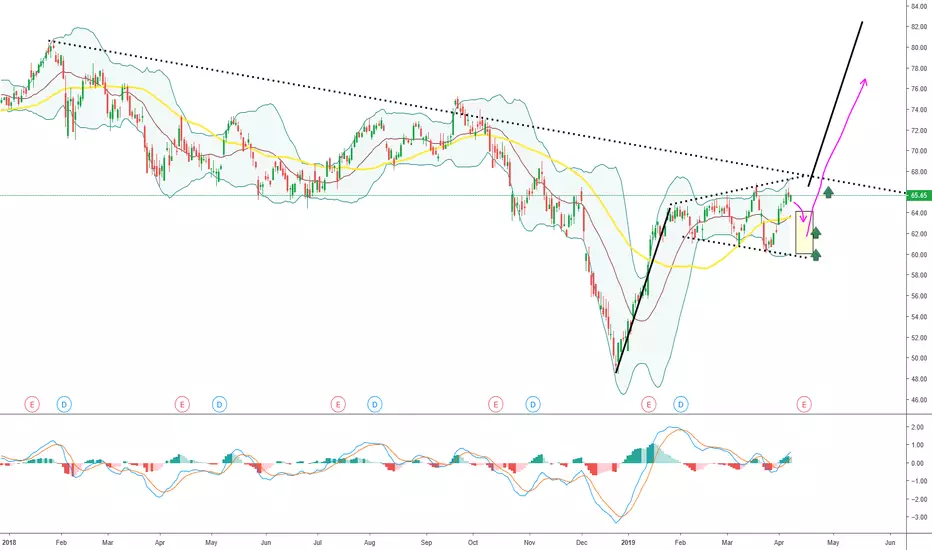
Citi Bank Bullish Breakout?Can we see a breakout in NYSE:C ?
I currently say this because ever since the 14th of January of 2019 it has been consolidating between the resistance line at the $65.23 and the support at $60.81.
For myself the RSI and MACD are the most important indicator to me. As you can see the MACD has crossed just before the 3rd run to the resistance and the RSI is yet to be oversold.
Posting this today the price has came close to the resistance line just by $0.6. I believe that if we see the price break through the resistance than it will breakout and we can see the target price to be around the $69.00 range.
ALSO, there was a big right triangle forming and as of today it has also broken through the right triangle resistance line. So this should be interesting to look at if it can break through 2 resistance lines.


C tough area here but getting stronger5/10ma cross rsi strong stochastic pointing up at supply zone so might break through

Citigroup SHORT64.02 region must hold strong in order for us to see another bearish leg unfold to 56.35.
Once we reach this supportive area, I expect a bit of sideways movement before confirmation of the next trend (be it bearish or bullish)
