CITI trade ideas

Financials Are signalling ugly picture but bottom may be closeWill be at $40/41 with tight stop at $38.40. Real-time alerts go www.2waytrading.com

C Thanks for raising mortgage rates and not deposit rates, jerksNot really a technical play, but a mid-term investment: rate hike lift off means more money for banks (unless Fed cuts it again, which would suck and make this view obsolete).


Very little price memory til 164 from here.......why was my stock of the year last year (guess I was early, but I'm long)
C Short based on divergenceLooking for a move lower based on a divergence between the price action and the stochastic. Price has made a higher high and the stochastic did not. Any weakness in the market has the potential to move the stock lower. If the market opens up tomorrow and there is any weakness in the stock I will enter July Puts.


C Waiting to break out of inv h&s (daily)If C manages to break out of the inverted head and shoulders, i see the following possible long targets:
T1 May-Jul: 60
T2 May-Dec: 80
A close on or above 54.80 is a confirmation of a break out. Price below 53.31 would require reevaluating the situation.

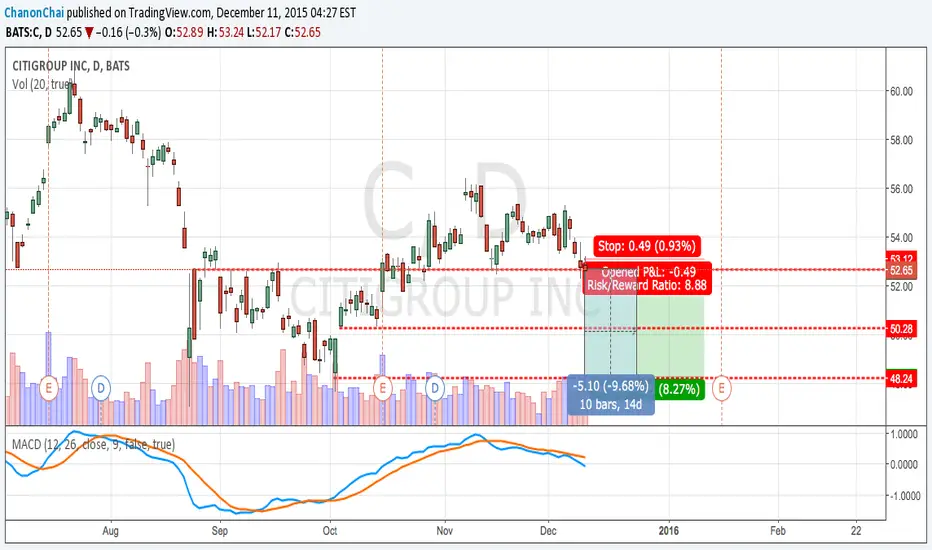
C - Supply Level ReachedSupply level line reached. Takeaway is probably just a few percentage points here.
Citi missed on their January earnings by 33%, so I don't understand the recent surge here... Shorting.

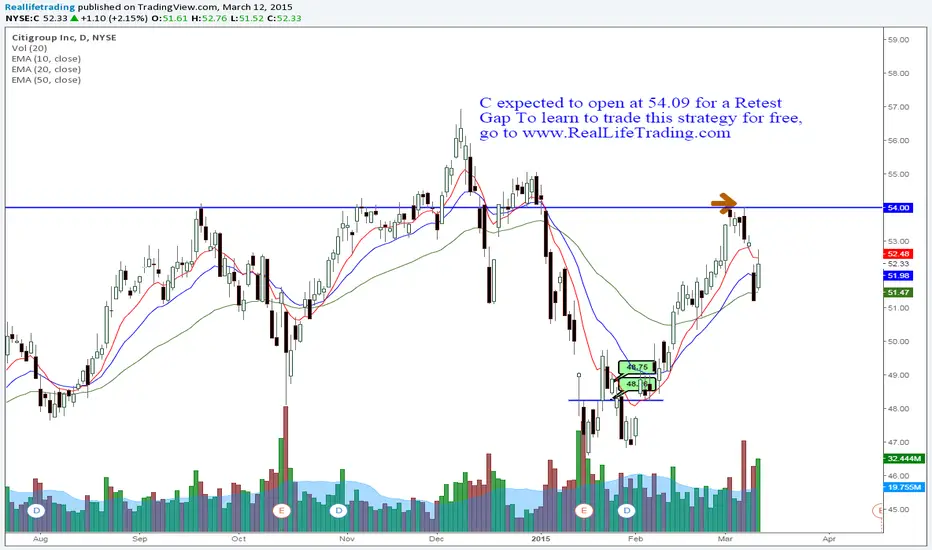
C Day Trade Retest Gap (Brad Reed Mar12,2015)C expected to open at 54.09 for a Retest Gap To learn to trade this strategy for free, go to www.RealLifeTrading.com


C - Awaken the sleeping giantCiti has been consolidating for about a year now. EMA's aren't extremely bullish but they're headed higher. Oscillators (Stochastics, RSI and MACD) look good for a bearish move. Just broke through the BB today with the relatively large shaved top candle. ADX is resting at 20, so it has plenty of room to get into the swing of things if C decides to make a run at closing the long standing gap.

Citigroup bullish shark & moreFriends,
We currently have a bullish shark pattern forming on the daily chart on Citigroup. The pattern will complete at 48.20's level, and expires at 47's level, the entry level for the shark pattern is confluent with structural support, increasing the integrity of this pattern.
Citigroup is also currently in a area of historic support/resistance. This is an area where people are looking for buying opportunities. I'm keeping my eye on this one at the moment, looking for a buy opportunity. The stochastic is currently in an oversold condition, and probably will be the for next few days, so buying pressure might begin to take fold and show some bullish signals. The S/R zone could prove to be a good zone to buy this, BUT at this moment in time it is NOT ready to buy. But over the next few days a buying opportunity could possibly arise in this historic S/R level.
(Note: We've been bearish on the last 2 days candles, and todays candle SO FAR.)
Good luck traders.

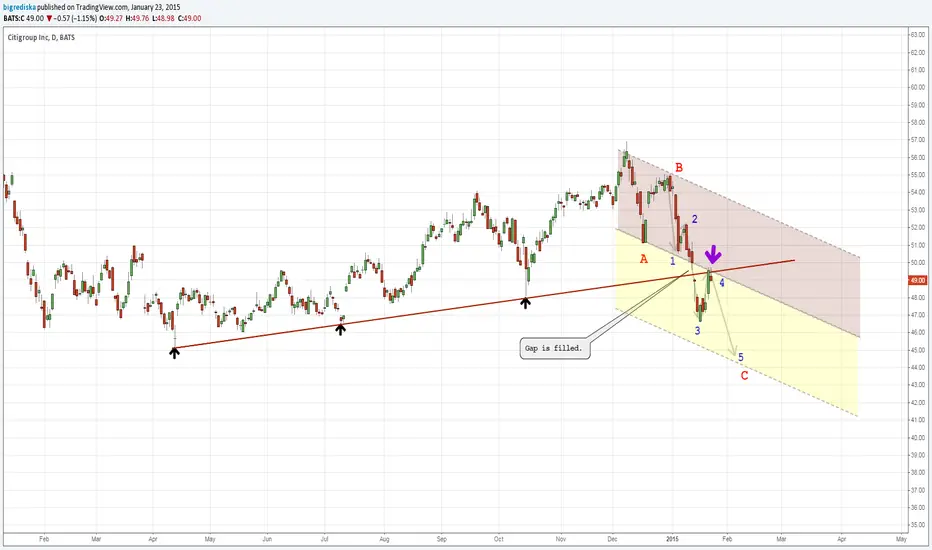
Citigroup Prediction.1)Primary trend is uptrend.(Black trend line)
2)Blue trend line is also uptrend.
3)MAs 7,17,30 has not smashed yet from the candles and the movement is going up.
From 1 , 2, 3 we can predict that the price of stock is generally in an uptrend movement.
If the price go below red , green and blue MA we start to sell a small amount of our position.
If the price continue and aprroach the black MA then we sell all of our position.(Attention that the primary trend has not be finished yet because we have the support of the black trend line)
Thanks.

$C looking for 50.70ish, then move higher to 58-60$CITIGROUP looking for small dip... then move to 58-60. Financials are still on slow grind as they try to fight the downward momo from 2008 capitulation. They are not fast movers like tech's but when they move, the entire market responds...

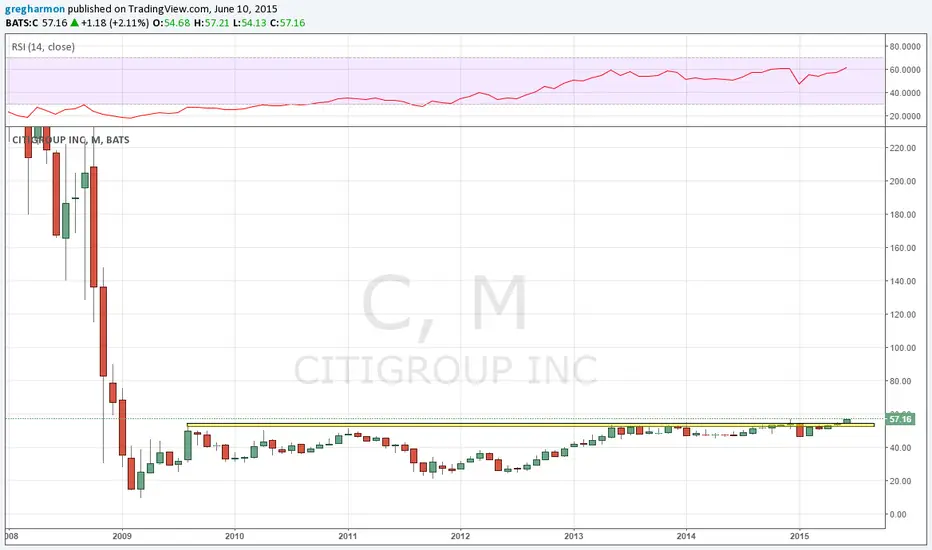
Citi continuing up!First of all... C was trading at values near 600 back in 2008.
Obviously it has been beatin and battered but it finally appears to have stabilized and recently broke out of its prior trading zone with short-term support at 51.12. Long-term support is at 45.06 but right now would be a good time to open a partial position because that 51.12 level held. I have a feeling that once this takes off there will be no looking back.
9/11 after close.

$C CITIGROUP looking for 52.40ish for short opportunityDistribution in process... target to 50-50.40ish... Should be nice 2-2.50 short over a week or so while they accumulate on way down... Bigger TF, this is very bullish as SPY, QQQ, and other strong sectors/indices...

OBSERVATION: Wide Spread Set-Up in PAIRS TRADE: C/WFCWells Fargo rallied back into a "key hidden level" resistance level and I found Citigroup as a hedge/pair to put on the position.
Tim 2:09PM EST 8/28/2014
