CITI trade ideas

Citibank Head & Shoulders Tilted body looks to be indicating a move further to the downside. We are going to possibly see a retracement back down to the $66 / $64 area.
NYSE:C

Financial Sector needs a pull backXLF is over-inflated (financial sector)
BlueWave will give a red dot sell signal soon.
Stochastic RSi is overbought.

C Expecting 7%+ higherI asked in my dowsing work what sectors may go down into the end of the year and got financials.
I thought that was kind of strange if rates are going up. But I went ahead and asked which of the bank stocks might have the easiest move down. The answer was $C.
This morning I notice C is actually up 2%, and as often happens in this work, I ask for something moving one way, but the answer given is opposite, so shame on me for not getting clarification.
Regardless, since this development and C far outpacing the others to the upside, I understand it's UP not DOWN!
I did receive the option for C to move up at least 10%. This is an untested attribute on my scale though, but I'm excited to see if it works out. From the low C is already pushing 3% (or may be there by now), but upside looks good in financials and especially C (for now).

UPDATE ON CITIGROUP Broke even won profits lost profits could have sold on both ends of the filed I might post an update tomorrow but I have officially let go of the position with only 20$ profit… Happy Trading new play to be posted soon.

ANOTHER FREE MONEY PLAY “C” CALLLooking at the history of this chart and it’s pattern the healthy downtrend and selling has stopped, I see tomorrow as a conformation and then Wednesday being a Green Day.
Easy and straight to the point you will be able to get in tomorrow and hold u till Wednesday! Happy Trading!!

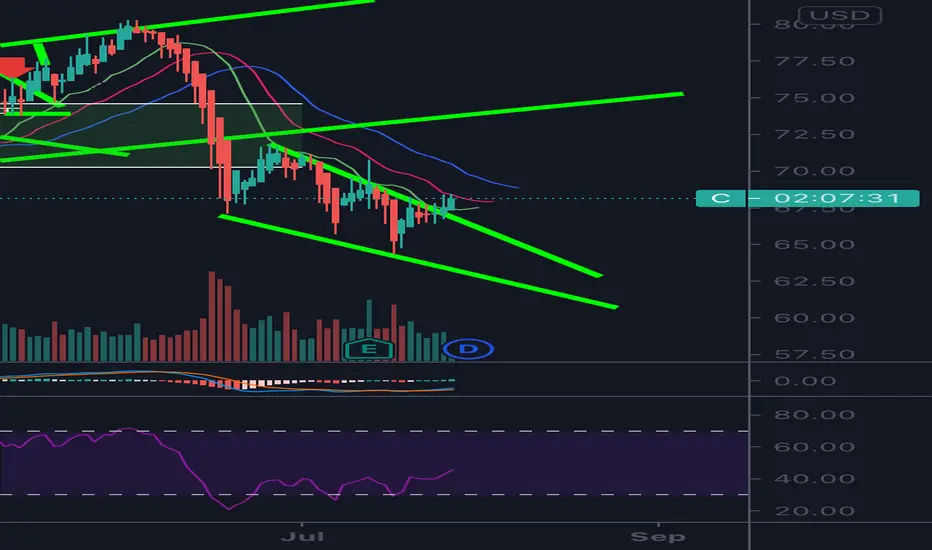
Cypher BullishC is over long entry level.
The Cypher pattern is a technical wave pattern in which the market is trending but it makes sharp reversals during the day. The important point of the bullish cypher is that both the lows and the highs are trending upwards. For the bearish pattern, the opposite happens.
If the cypher completes successfully with a reversal taking place at point D, it may eventually become a trend channel where the price moves between the highs and lows. Cyphers can also appear inside price channels that are already formed.
It is recognizable in it's bullish version by the 2nd peak being higher than the first like a bullish shark. D is the landing pad in the Cypher pattern and should land close to the .786 of XA.
No recommendation
Targets 2, longer term are 93 to 101

FREE MONEY PLAY FOLLOW UP “C” Hope everyone who got to see this post profited even tho I don’t got too many followers…
I hope if anyone did see this they held the position because it was a shake and bake kind of hold but I profited about 70% gain great hold fun position
More plays to come soon… all love!

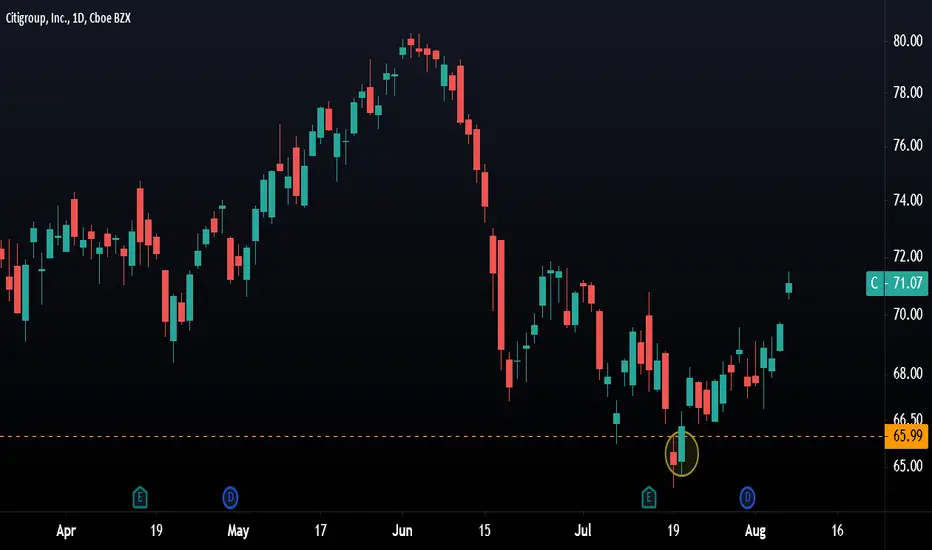
FREE MONEY PLAY “C” TO FALLI’m currently driving but the idea struck me the pattern and the chart formation, Citigroup is currently focused on one thing and that’s it pattern for this coming week “C” is focused on one thing and that’s it’s current pattern…
I know you see just an arrow pointing down cans now technical level fundamental pattern, I’m going based on the strength of the last drop and how it acts as a conformation candle currently trying to form an “inverted head and shoulders pattern” you can see by the length and duration of this chart while it was at its peak if it’s current pattern about 3 trading days ago… Notice also on the day 08/19/2021 (Today) that it’s open gap did not close has continued to drop, Matter of fact an older gap that occurred 2 weeks ago has closed and if we follow the pattern on how many gaps have been left “open” in the last 2 weeks 2 other gaps have not closed… If you study gaps you know about 75% - 80% of gaps do close so I see these gaps as retroactive meaning the more gaps left unclosed the higher the chance of just ONE gap being closed.
That’s not all what’s based on this pattern it’s not just technical analysis and fundamental trading with balance sheets that predicts stock movement but sometimes the actual “energy” and consistency of healthy buying and selling which runs the gears… Think of a refrigerator that has a consistent source of electricity your food will remain cold that’s what this chart is showing us this week the consistency of all the buying and selling no drama to make this stock act on impulse as well as no news remaining low key while doing its “job” as I stated this chart formation is a result of trading consistency no games or turn of events this chart will follow its pattern following a hard drop it will drop again not as hard but about half the previous candle like a train following a path it dosnt stop instantly but need to hit the breaks blow the whistle and let the sparks fly from the friction of the breaks to the track…
Target price is $69.00 of $68.50 these are the areas we will start to see resistance and this is
The price range in which I well sell, From a contract trading at .50-.60 cents “C” Citigroup has low volatility that works for it in this trade making the contracts cheap and a full dollar drop will easily gain you a 50% to a 75% gain… Happy trading my fellow warrior!!!

Citi Holds the 50-day SMAFinancial stocks have bounced in the last two weeks, and Citi is one of the biggest members of the group.
A few patterns stand out on the banking giant’s chart. First is its breakout above the 50-day simple moving average (SMA), followed by a pullback to hold that line.
Next is the late June highs around $71.50, near the current level.
Third, notice how the 8-day exponential moving average (SMA) is now above the 21-day EMA. This may indicate shorter-term momentum has grown more bullish. In addition, MACD has been rising for almost a month.
Overall, C is one of the weaker names in the financial space. However this current setup may offer more apparent entries than stronger stocks like Goldman Sachs and Wells Fargo . It also stands to benefit if the current rotation toward value continues and the Federal Reserve tapers (as officials like Raphael Bostic and Richard Clarida have suggested this month).
TradeStation is a pioneer in the trading industry, providing access to stocks, options, futures and cryptocurrencies. See our Overview for more.

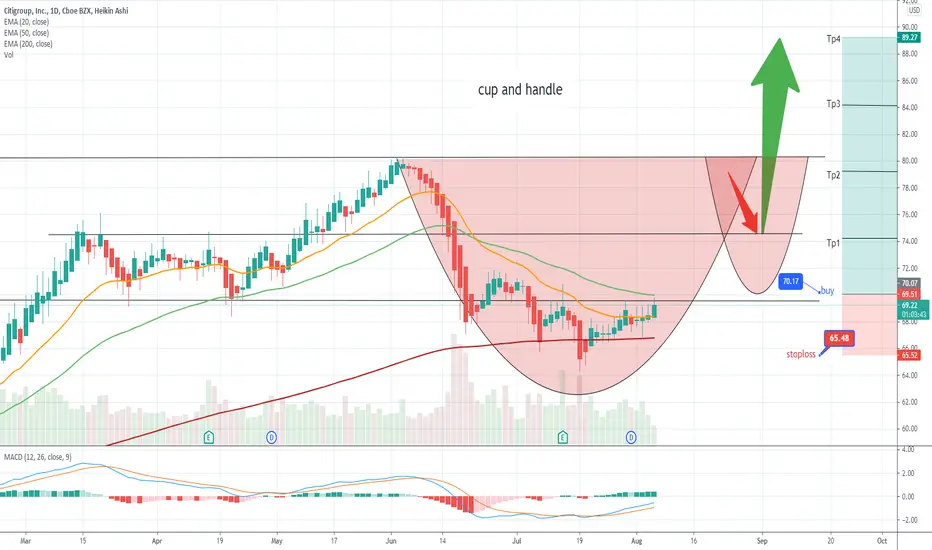
$C Phase E Wyckoff Accumulation PhaseWent long 9/17 $75c with Citigroup breaking out text book Wyckoff Accumulation phase. Target is previous AH. Expecting consolidation along the way .
Stop below anchored VWAP $70.4

Citigroup Stock OpportunitiesCitigroup rejected nicely from my prz zone. Expect a long term move to the downside.


C: Inverted H&S brokeA call was given on 26th July, bought at 67.06. The profit should now be running at 130% of the risk risked. The price has broke up a minor trendline and also formed an inverted H&S, should have more momentum coming. To be safe, you may move you stop to secure your trade.

Citigroup: Target Exceeded. Now 7% Higher From Entry Citigroup: Target Exceeded. Now 7% Higher From Entry.
Original Idea Attached.
Citigroup (and entire banking sector) Ready to Break OutCitigroup (C) looks like its getting ready for another move up. After falling all of June and July, its appears to have bounced off the positive 200 day MA. Although volume isn't as high as you'd like for a breakout, the CCI looks very strong. All that combined with the descending triangle breakout, the 20 day MA cross, and the upper bollinger band being hit - looks like a possible buy!

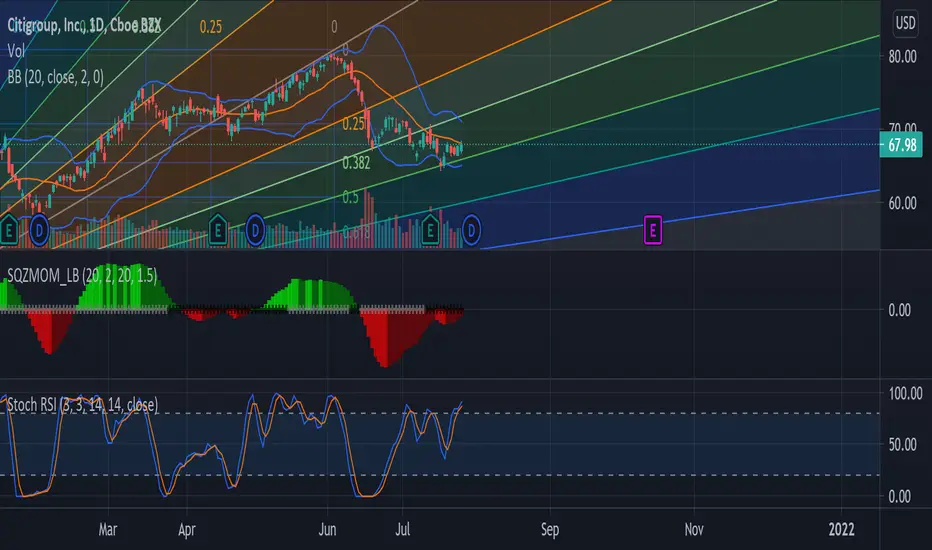
Great Buy Zone( C ) If you've seen my prior analysis on C then you know I'm very bullish on this stock. Right now I believe it is the best time to buy due to mean reversion that just occurred. If you want to know my overall thoughts on this stock then view my profile. But summed up. The weekly and daily display a great squeeze to the up side.

CCiti group finally broke down from a rising channel I had been watching for a while. We created a falling wedge after downside target was hit. We got a great daily candle above this downward resiatnce. I am looking for a 74$ target range which could bring us back to test the rising channel previous support looks bullish short term here
Great Entry for Citigroup Great Up-move to be expected. A squeeze is about to occur on the daily while also holding its support. Another indication towards bullish sentiment is the Stochs Bullish Divergence. Not only does the daily suggest an up-move, but the weekly indicates an oversold condition. Price targets are 73 then 80.
Bullish Signals
-Squeeze
-Stoch Divergence
-Fib Support
-Weekly oversold
Price Targets
-1st 73
-2nd 80

$C Chart IdeaAt a pivot point Resistance here for Citi. Since only two days left in the week I could see a sharper move than the week of 7/12

CITIGROUP FREE MONEY PLAY RECAP! Great position quick easy 100-150% gain because of volatility this chart barley moves making option prices cheaper! The gist of predicting this pattern was dude to Moving averages and just the placement of the candles and patterns at the time I made my first post regarding this play!
Hope you all had a great trade, Happy trading!
Stay followed for more free money plays!
