CSCO Log Chart AnalysisGood reclaim of important monthly level, I'd prefer to see a nice retrace back to 57s but the opportunity cost may outweigh the better entry. We're entering peak euphoria ranges from the internet bubble... if we escape this range, north of $82 the fun really starts. All time highs are a mere 40% away, with 50%+ upside from there.
Take profit levels marked using fib retracement of the internet bubble top and bottom. I expect this to run from this spot, good R:R with scaled stops under the monthly level.
Considering this analysis was done at high time frame, it may take a while to play out. Below 53.41, I think this trade is invalidated.
CSCO trade ideas

CSCO - Just a chart(No opinion)
Could easily reject here and fail quickly or limited upside near term with RSI over-heated..
Negative divergences on RSI and CCI

Cisco Time for the pullbackAlmost reached the top of consolidation (58$).
Primary pattern is a huge double bottom
Secondary pattern -Rising wedge
I think we see a pullback here to the 48-50$ area to make a handle for the double bottom before making new ATH.
If this dumps past 48$ we're headed back to 40$...
Pull back signs?
1.Top of the wedge
2. Volume decreasing
3. MFI flashing
4.Macd overbought

CSCO breaking bear out of Rising wedge. BULLS WATCH OUT!Watch out! Especially because FED wants to "taper" their money printing as per their latest FOMC meeting minutes

Strong bull market The ✅DAX pointing up! This is one of the instruments contributing to towards that movement

CSCO Breakout Aug 3 - seeing CSCO breaking out of 55.40 and this is a positive sign.
Could be worth going long on this one ... it's sitting right above the EMA8 very bullish sign. With tech companies reporting strong recently and we could only expect CSCO to do the same .


CSCO: Consolidation.Consolidation is broken upwards with the minimum target level around 65. The next target is based on the breakout of the long-term resistance level with the minimum target level around 80.

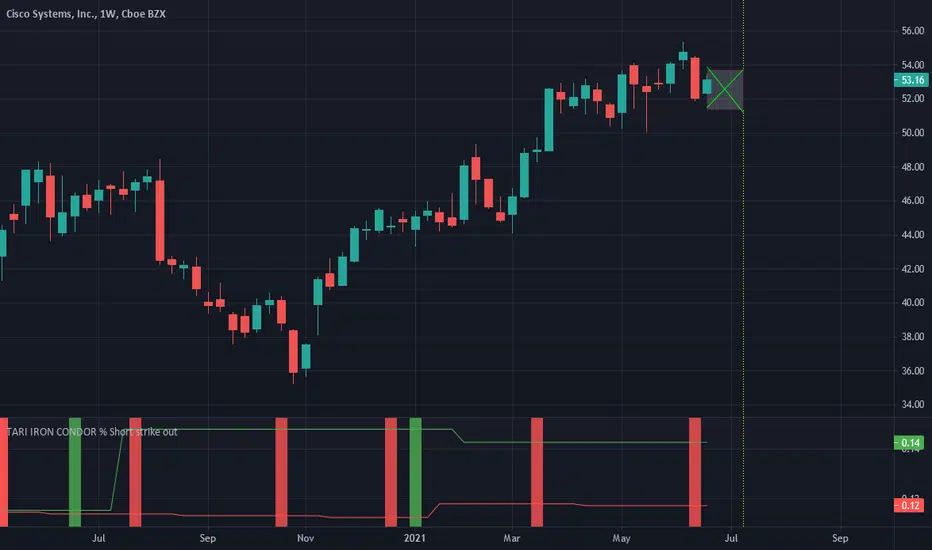
Iron TariHi guys,
this is again a CSCO short condor, 4 weeks and 3% strike, gives 30$ credit for 1 dollar Spread. RR is 30/70=0.42, but according to the strategy the odds are at our side, 88% to earn all the premium.
The short strikes are 51 and 54, so BE are at 51.30 and 53.70.
Subscribe for free to my indicator!
Enjoy your wallet!
Tari.
CSCO Flush UpTook this trade in anticipation of the flush up. Factors included Index turning bullish, parabolic SAR, Stochastics, and MACD turning bullish.
Target price based off previous flush up distance, and also at next support


50 100 & 200 MAsThe 50MA 100MA 200MA are indicators i used most on a day chart to determine if the chart is a good chart to swing trade and i use the weekly to determine trades for L.E.A.P.S. with those same indicators

CSCO Possible (much needed) BreakoutYou can see the resistance, downtrend had been getting less and less steep, while each time there is a low point there is a lot of Volume. Also, the upward trend is starting to increase as well. NASDAQ:CSCO is undervalued IMO. Their equipment is in every major company and they are not held back by the chip shortage since they produce different products.


Cisco Bounces at the 50-day SMACisco Systems had a big surge in March, followed by two months of upward sloping consolidation. Now the chart may be signaling another leg to the upside.
First, prices have held the 50-day simple moving average (SMA) and are bouncing. That suggests the uptrend is intact.
Second, notice the sharp drop on June 18 followed by a quick rebound. That resulted in a kicker candlestick pattern -- a sign of buyers lurking beneath the surface.
Next, CSCO closed above its 21-day exponential moving average (EMA) yesterday for the first time since June 15. That could soon pull the 8-day EMA above the 21-day EMA, which could indicate shorter-term momentum is getting bullish.
Fourth, CSCO just completed a bullish inside week. That can be a sign of prices stabilizing before a push to the upside.
TradeStation is a pioneer in the trading industry, providing access to stocks, options, futures and cryptocurrencies. See our Overview for more.


CSCO solid area of valueGreat low risk trade here. Broke a trend line and showing strength.
Trade smart have fun!
Invest in alternate assets today. Beat the S&P by 10X!!! Check out my profile and save on management fees!


