DIS getting punished for taking business away from NFLXDIS is a solid company with many different avenues to make money; they are a BEAST. NFLX is... well not. NFLX only streams content and much of the content they have streamed over the past 20 years during their growth, they didn't own. It was just a matter of time for the company to feel the pain of competition from the market place. Over the past few years, we have seen HBO max, Amazon Prime, DIsney +, Paramount +, and other come to market with streaming services. Many of which had contracts to allow NFLX to stream their content, but that has changed as those contracts have expired and those other platforms are now streaming their own content.
DIS has so much more to offer than just streaming; broadcasting (TV), amusement parks, cruises, and the most MASSIVE content library. DIS is getting punished today and they shouldn't be, as they have adapted with the times. If there is any company that offers the TOTAL entertainment package, it's definitely DIS. Be bullish, this dip is dump.
DIS trade ideas

Disney: Try AgainDisney
Short Term - We look to Sell at 127.19 (stop at 131.94)
A break of bespoke support at 130.00, and the move lower is already underway. Trades with a bearish descending triangle formation. Our outlook is bearish. The trend of lower highs is located at 142.00. News events could adversley affect the short term technical picture.
Our profit targets will be 113.78 and 102.30
Resistance: 130.00 / 144.00 / 155.00
Support: 110.00 / 100.00 / 90.00
Disclaimer – Saxo Bank Group. Please be reminded – you alone are responsible for your trading – both gains and losses. There is a very high degree of risk involved in trading. The technical analysis, like any and all indicators, strategies, columns, articles and other features accessible on/though this site (including those from Signal Centre) are for informational purposes only and should not be construed as investment advice by you. Such technical analysis are believed to be obtained from sources believed to be reliable, but not warrant their respective completeness or accuracy, or warrant any results from the use of the information. Your use of the technical analysis, as would also your use of any and all mentioned indicators, strategies, columns, articles and all other features, is entirely at your own risk and it is your sole responsibility to evaluate the accuracy, completeness and usefulness (including suitability) of the information. You should assess the risk of any trade with your financial adviser and make your own independent decision(s) regarding any tradable products which may be the subject matter of the technical analysis or any of the said indicators, strategies, columns, articles and all other features.
Please also be reminded that if despite the above, any of the said technical analysis (or any of the said indicators, strategies, columns, articles and other features accessible on/through this site) is found to be advisory or a recommendation; and not merely informational in nature, the same is in any event provided with the intention of being for general circulation and availability only. As such it is not intended to and does not form part of any offer or recommendation directed at you specifically, or have any regard to the investment objectives, financial situation or needs of yourself or any other specific person. Before committing to a trade or investment therefore, please seek advice from a financial or other professional adviser regarding the suitability of the product for you and (where available) read the relevant product offer/description documents, including the risk disclosures. If you do not wish to seek such financial advice, please still exercise your mind and consider carefully whether the product is suitable for you because you alone remain responsible for your trading – both gains and losses.


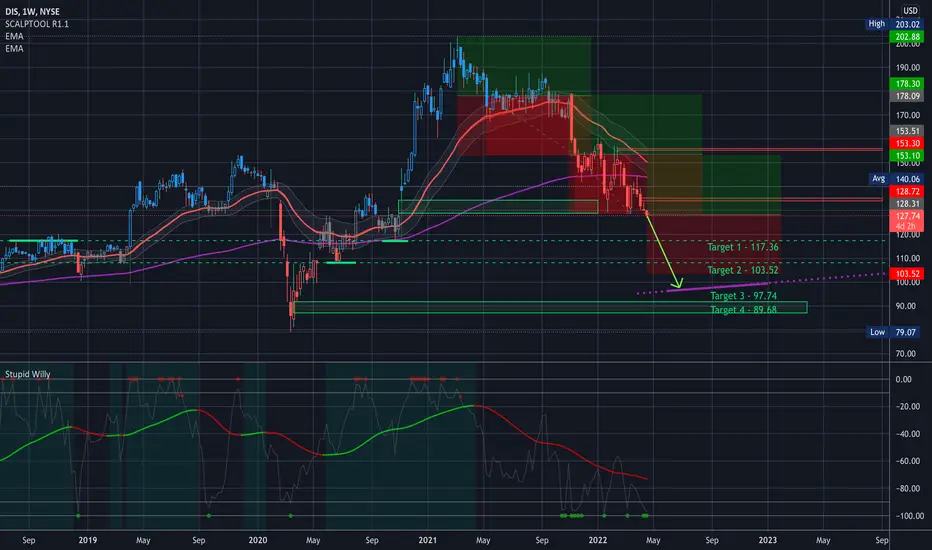
$DIS Disney Key Levels, Analysis, & Targets $DIS Key Levels, Analysis, & Targets
Do I think that Target 4 will hit… also-freakin’-lutely…
I had to do some research to make sure that a move like that is justified with Disney… and it definitely is…
I have my alerts set for Target 4…
I don’t trade or accumulate this regularly so I don’t think I’ll be starting a position any higher than target 3… If it gets below the purple EMA line (Which is the 180EMA carried over from the Monthly Chart) I will consider a long position…
—-
I am not your financial advisor. Watch my setups first before you jump in… My trade set ups work very well and they are for my personal reference and if you decide to trade them you do so at your own risk. I will gladly answer questions to the best of my knowledge but ultimately the risk is on you. I will update targets as needed.
GL and happy trading.
IF you need anything analyzed Technically just comment with the Ticker and I’ll do it as soon as possible…
Disney - DIS - a more bearish view I posted a bullish idea on this stock back in February suggesting that we may be about to see another leg up. This is a more bearish count that suggests we may have actually seen a significant top for Disney and a protracted correction is just getting started.

Disney: This One Doesn't End WellDisney
Short Term - We look to Sell a break of 128.13 (stop at 131.49)
A break of bespoke support at 130.00, and the move lower is already underway. Trades with a bearish descending triangle formation. Our outlook is bearish. The trend of lower highs is located at 142.00. Continued downward momentum from 160.00 resulted in the pair posting net daily losses yesterday.
Our profit targets will be 116.29 and 102.30
Resistance: 142.00 / 158.00 / 185.00
Support: 130.00 / 120.00 / 100.00
Disclaimer – Saxo Bank Group. Please be reminded – you alone are responsible for your trading – both gains and losses. There is a very high degree of risk involved in trading. The technical analysis, like any and all indicators, strategies, columns, articles and other features accessible on/though this site (including those from Signal Centre) are for informational purposes only and should not be construed as investment advice by you. Such technical analysis are believed to be obtained from sources believed to be reliable, but not warrant their respective completeness or accuracy, or warrant any results from the use of the information. Your use of the technical analysis, as would also your use of any and all mentioned indicators, strategies, columns, articles and all other features, is entirely at your own risk and it is your sole responsibility to evaluate the accuracy, completeness and usefulness (including suitability) of the information. You should assess the risk of any trade with your financial adviser and make your own independent decision(s) regarding any tradable products which may be the subject matter of the technical analysis or any of the said indicators, strategies, columns, articles and all other features.
Please also be reminded that if despite the above, any of the said technical analysis (or any of the said indicators, strategies, columns, articles and other features accessible on/through this site) is found to be advisory or a recommendation; and not merely informational in nature, the same is in any event provided with the intention of being for general circulation and availability only. As such it is not intended to and does not form part of any offer or recommendation directed at you specifically, or have any regard to the investment objectives, financial situation or needs of yourself or any other specific person. Before committing to a trade or investment therefore, please seek advice from a financial or other professional adviser regarding the suitability of the product for you and (where available) read the relevant product offer/description documents, including the risk disclosures. If you do not wish to seek such financial advice, please still exercise your mind and consider carefully whether the product is suitable for you because you alone remain responsible for your trading – both gains and losses.

$DIS Watching this $130 area on Disney.. Big pivot point. No position yet, but interested to see how we react here.

DIS TO $180. $130, $125, $115 support Dis approaching support level $130, $125, $115. Im buying at these levels for long with a target of $180. Disney will see COVID relief rally and economy recovery. This market may take years to see the effects of further rate increase.
Debt is questionable, don’t ask questions
This is not financial advice. It’s only is for entertainment.

DISney has entered the culture warnever seen this work out in a positive way for a company not sure why they always try to play this card. never a good idea to split your userbase. besides that retestd support at the 80s so next step is 69 on the downside. good luck out there mickey

Disney- Bounce from $129 🚀Disney approaching oversold right as it nears its support. Combine this with the bullish shark pattern, I think this is poised to recover nicely.

DIS at SupportOn Friday DIS closed at strong support and if bullish momentum continues in the market we could see it crossing $145 ~ $150 in April.

DIS Boycott POOTSPrice is in a previously used demand zone. Puts below 136.28 still look good down to 134-132.67. 135.57 was the low today (4/1).


DisDIS gave a sharp pull back at the end of last week. At the opening bell DIS created a gap to the downside. Let's see if the gap down create a bear flag and continue the downtrend.

Parabolic SARA sell signal is given when the lower SAR Crosses the price line
A buy signal is given when the upper SAR crosses the price line

Longing Disney. DISGoals 150, 156. Invalidation at 129 .
We are not in the business of getting every prediction right, no one ever does and that is not the aim of the game. The Fibonacci targets are highlighted in green with invalidation in red. Fibonacci goals, it is prudent to suggest, are nothing more than mere fractally evident and therefore statistically likely levels that the market will go to. Having said that, the market will always do what it wants and always has a mind of its own. Therefore, none of this is financial advice, so do your own research and rely only on your own analysis. Trading is a true one man sport. Good luck out there and stay safe

Disney back in business ⚡nice bounce off cluster support recently, looking to go long if we break 141.08, will play downside if we break below 127.97


Swing trade from supportNot a very complicated trade, NYSE:DIS bounced off support a few times while in a bear market.

$DIS with a Bullish outlook following its earnings #Stocks The PEAD projected a Bullish outlook for $DIS after a Positive over reaction following its earnings release placing the stock in drift B with an expected accuracy of 64.29%.

DISNEY - $126Disney shares are down over 32% from their all time high. Looking to pick up some Disney Shares in that golden pocket range under $126.
Disclaimer:
I do not provide personal investment advice and I am not a qualified licensed investment advisor. I am an amateur investor.
All information found here, including any ideas, opinions, views, predictions, forecasts, commentaries, suggestions, or stock picks, expressed or implied herein, are for informational, entertainment or educational purposes only and should not be construed as personal investment advice. While the information provided is believed to be accurate, it may include errors or inaccuracies. I will not and cannot be held liable for any actions you take as a result of anything you read here.
Conduct your own due diligence, or consult a licensed financial advisor or broker before making any and all investment decisions. Any investments, trades, speculations, or decisions made on the basis of any information found on here, expressed or implied herein, are committed at your own risk, financial or otherwise.
Feel free to give us a follow and shoot us a like for more analysis updates.

Double Bottom in Disney?Walt Disney has been under pressure for the last year. But now it may have formed a bullish reversal pattern.
DIS dove toward $129.30 on January 24 during the S&P 500’s initial swoon this year. It retested and held that level on Tuesday, resulting in a potential double-bottom pattern.
Next, the pullback represents a retracement of the entire rally that occurred in late 2020 and early 2021 after Pfizer’s vaccine news spurred confidence in the economy reopening .
Third, stochastics have dipped to an oversold condition.
The trend remains bearish and sentiment is negative following the spike in gasoline and jet-fuel prices. However this double-bottom pattern could make traders start to think about a bounce .
TradeStation has, for decades, advanced the trading industry, providing access to stocks, options, futures and cryptocurrencies. See our Overview for more.
Important Information
TradingView is not affiliated with TradeStation Securities Inc. or its affiliates. TradeStation Securities, Inc., TradeStation Crypto, Inc., and TradeStation Technologies, Inc. are each wholly owned subsidiaries of TradeStation Group, Inc., all operating, and providing products and services, under the TradeStation brand and trademark. When applying for, or purchasing, accounts, subscriptions, products and services, it is important that you know which company you will be dealing with. Please click here for further important information explaining what this means.
This content is for informational and educational purposes only. This is not a recommendation regarding any investment or investment strategy. Any opinions expressed herein are those of the author and do not represent the views or opinions of TradeStation or any of its affiliates.
Investing involves risks. Past performance, whether actual or indicated by historical tests of strategies, is no guarantee of future performance or success. There is a possibility that you may sustain a loss equal to or greater than your entire investment regardless of which asset class you trade (equities, options, futures, or digital assets); therefore, you should not invest or risk money that you cannot afford to lose. Before trading any asset class, first read the relevant risk disclosure statements on the Important Documents page, found here: www.tradestation.com .
