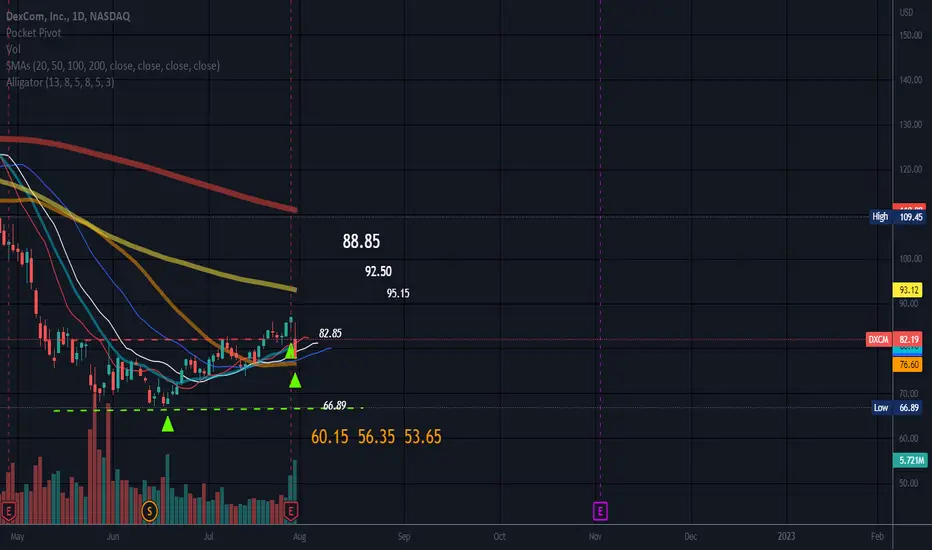
$DXCM LONG!Triple Inside weeks here , tight range , looking for a break
above prev days close , 126.71 Long above 127.25 ,
Risk at 126.35 For a possible move into 131! NASDAQ:DXCM
Possible swing into 134 if we break hod!
DXCM trade ideas


DXCM WCA -Cup and Handle Company: Dexcom Inc.
Ticker: DXCM
Exchange: NASDAQ
Sector: Health Technology
Introduction:
Our technical analysis today concentrates on Dexcom Inc. (DXCM), a prominent name in the Health Technology sector, listed on the NASDAQ. A potential Cup and Handle pattern, serving as a reversal formation, has been forming on the weekly chart, suggesting a promising setup for bullish traders.
Cup and Handle Pattern:
The Cup and Handle pattern typically emerges during a period of consolidation, signifying a potential bullish reversal or continuation. It's recognized by a "cup" formation, followed by a smaller "handle".
Analysis:
Previously, Dexcom was experiencing a clear downward trend, represented by the blue diagonal line. However, the trend appears to be changing, with the price now consolidating in a Cup and Handle pattern. Though the handle's size is slightly larger than the norm, the well-defined horizontal resistance at 125.58 lends credibility to the pattern's significance.
The price is standing above the 200 EMA, confirming a bullish environment. If the price breaks above the horizontal resistance, it could present an excellent opportunity for a long position. The subsequent price target is projected at 184.24, indicating a potential upside of approximately 46.69%.
Conclusion:
The weekly chart of Dexcom reveals an interesting Cup and Handle pattern, hinting at a potential bullish reversal. As such, this setup could provide a favorable long trading opportunity.
Disclaimer: This analysis is not financial advice and is intended for educational purposes only. Always do your own research and consult with a financial advisor before making investment decisions.
If you found this analysis helpful, please consider liking, sharing, and following for more insights. Wishing you profitable trading!
Best regards,
Karim Subhieh

RectanglePrice appears to be bound by 2 trendlines is a horizontal trading zone.
Rectangles like many patterns are neutral until broken.
The top line is R and the bottom line is S.
No recommendation/Bearish Harami so far today
Day Range
113.05
115.47
EPS (FWD)
1.04
PE (FWD)
109.94
Div Rate (TTM)
-
Yield (TTM)
-
Short Interest
3.38%

DXCM Up On Volume$DXCM up on volume. Looking for a retest here before entry. Still has a couple highs to break through as well as a support zone but the R/R is good.

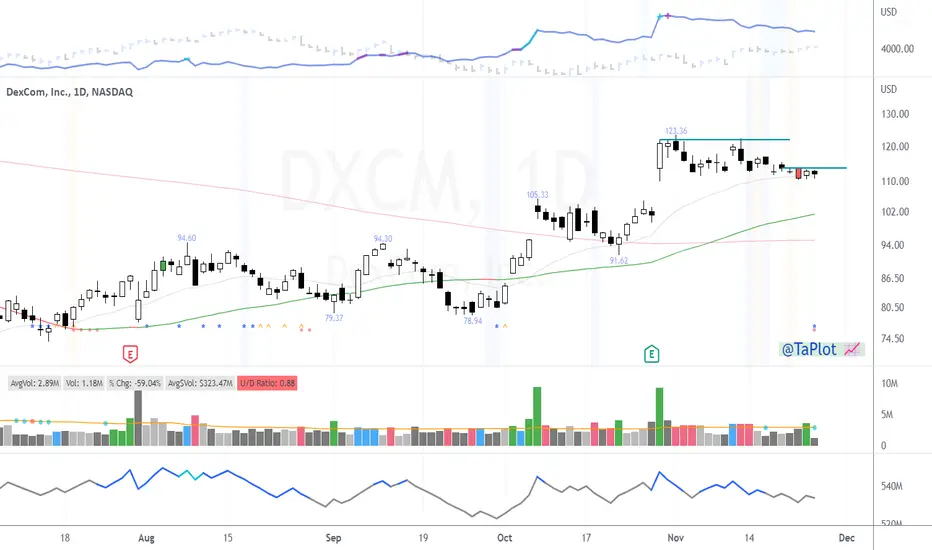
DexCom Pulls Back After an Earnings RallyDiabetes company DexCom has consolidated for about four months, and now it could be trying to move again.
The first pattern on today’s chart is the bullish candle on February 10 after earnings beat estimates. It followed a similar rally on October 28, suggesting that investors are pleased with its fundamental performance.
The earnings surge established DXCM above its 50-day simple moving average (SMA) and a trendline along the recent highs. Some traders may view that as a breakout.
Next, MACD has been rising all month.
Finally, the 50-day SMA had a “golden cross” above the 200-day SMA in November. Has the longer-term trend grown more bullish?
TradeStation has, for decades, advanced the trading industry, providing access to stocks, options, futures and cryptocurrencies. See our Overview for more.
Important Information
TradeStation Securities, Inc., TradeStation Crypto, Inc., and TradeStation Technologies, Inc. are each wholly owned subsidiaries of TradeStation Group, Inc., all operating, and providing products and services, under the TradeStation brand and trademark. TradeStation Crypto, Inc. offers to self-directed investors and traders cryptocurrency brokerage services. It is neither licensed with the SEC or the CFTC nor is it a Member of NFA. When applying for, or purchasing, accounts, subscriptions, products, and services, it is important that you know which company you will be dealing with. Please click here for further important information explaining what this means.
This content is for informational and educational purposes only. This is not a recommendation regarding any investment or investment strategy. Any opinions expressed herein are those of the author and do not represent the views or opinions of TradeStation or any of its affiliates.
Investing involves risks. Past performance, whether actual or indicated by historical tests of strategies, is no guarantee of future performance or success. There is a possibility that you may sustain a loss equal to or greater than your entire investment regardless of which asset class you trade (equities, options, futures, or digital assets); therefore, you should not invest or risk money that you cannot afford to lose. Before trading any asset class, first read the relevant risk disclosure statements on the Important Documents page, found here: www.tradestation.com .

$DXCM Pullback Buy Setup$DXCM pullback buy potentially triggers tomorrow morning.
Less than 2% stop loss to figure out if you are wrong.
They don't get any mush low risk setups than this.

Dexcom Bullish - pre earningsI would place a limit buy order if it retest downwards. Earnings on Thursday and common positive outlook by analysts.

DXCM breakout?May continue to consolidate into earnings but if the downward line breaks bullish then go long. Nice targets almost 4:1 risk with the stop below the support zone.

$DXCM Finding Buyers Below Its 50 MAI picked up some $PODD on Friday per my tweet.
Feels like rotation back to medical names might start to give tech a pause after its strong move.
$DXCM appears to be setting in a similar fashion and finding buyers to support it right below its 50 MA.

DexCom: Potential Early Bearish C EntryDexCom appears to be in a Diamond Pattern while showing big MACD Hidden Bearish Divergence on the Weekly Timeframe that could later lead to a Confirmed ABCD/Gartley BAMM Harmonic breakdown upon the breaking the B point which from there likely could take it down to the Pattern Completion Zone of $30.64.
I will be playing this via the currently slightly OTM: FEB and MARCH $100 Striked Puts.

DexCom to breakdown?DexCom - 30d expiry - We look to Sell a break of 108.48 (stop at 113.03)
We are trading at overbought extremes.
Although the bulls are in control, the stalling positive momentum indicates a turnaround is possible.
A break of the recent low at 108.68 should result in a further move lower. This stock has seen poor sales growth.
Levels above 122 continue to attract sellers.
Our profit targets will be 97.11 and 95.11
Resistance: 118.00 / 120.00 / 125.55
Support: 108.68 / 105.00 / 100.00
Please be advised that the information presented on TradingView is provided to Vantage (‘Vantage Global Limited’, ‘we’) by a third-party provider (‘Signal Centre’). Please be reminded that you are solely responsible for the trading decisions on your account. There is a very high degree of risk involved in trading. Any information and/or content is intended entirely for research, educational and informational purposes only and does not constitute investment or consultation advice or investment strategy. The information is not tailored to the investment needs of any specific person and therefore does not involve a consideration of any of the investment objectives, financial situation or needs of any viewer that may receive it. Kindly also note that past performance is not a reliable indicator of future results. Actual results may differ materially from those anticipated in forward-looking or past performance statements. We assume no liability as to the accuracy or completeness of any of the information and/or content provided herein and the Company cannot be held responsible for any omission, mistake nor for any loss or damage including without limitation to any loss of profit which may arise from reliance on any information supplied by Signal Centre.

RectangleHorizontal trading channel that is neutral until broken.
Price is above the .382 of the trend up.
Price is hanging on the support line.
No recommendation
EPS (FWD)
0.80
PE (FWD)
139.73
Div Rate (TTM)
-
Short Interest
3.39%
Market Cap
$43.04B


Down for some profit taking, get in now.I believe that DMCX has more upside, almost broke 120 today but market is down and pull it back.
I m have already added at this curret level and will add more at around 114 ( if it gets there).
Hoping it will go up to 122 and even 130.
SL at 109

$DXCM Mini coil at its 21 EMA$DXCM mini coil with double inside right at its 21 EMA earning gap up.
Nothing but another low risk entry.
These "should" work, if they don't, you know market is still shitty.
Potential Uptrend in DexComDiabetes company DexCom has been fighting higher since June, and now it may be interesting to trend followers.
The first pattern on today’s chart is the pair of bullish gaps last month.
The initial rally came after the Centers for Medicare and Medicaid Services proposed expanding access to one of the company’s glucose-monitoring products. The second was triggered by strong quarterly results and guidance. Those jumps suggest a catalyst-driven uptrend could be taking shape.
DXCM has consolidated for almost a month, and last week bounced near the low from its most recent gap. Has support been established at the higher level?
Next, prices have held the rising 21-day exponential moving average (EMA).
Additionally, the 50-day simple moving average (SMA) rose above the 200-day SMA on November 8. That “golden cross” could suggest its longer-term uptrend has turned positive again.
Finally, stochastics are back to an oversold condition.
TradeStation has, for decades, advanced the trading industry, providing access to stocks, options, futures and cryptocurrencies. See our Overview for more.
Important Information
TradeStation Securities, Inc., TradeStation Crypto, Inc., and TradeStation Technologies, Inc. are each wholly owned subsidiaries of TradeStation Group, Inc., all operating, and providing products and services, under the TradeStation brand and trademark. You Can Trade, Inc. is also a wholly owned subsidiary of TradeStation Group, Inc., operating under its own brand and trademarks. TradeStation Crypto, Inc. offers to self-directed investors and traders cryptocurrency brokerage services. It is neither licensed with the SEC or the CFTC nor is it a Member of NFA. When applying for, or purchasing, accounts, subscriptions, products, and services, it is important that you know which company you will be dealing with. Please click here for further important information explaining what this means.
This content is for informational and educational purposes only. This is not a recommendation regarding any investment or investment strategy. Any opinions expressed herein are those of the author and do not represent the views or opinions of TradeStation or any of its affiliates.
Investing involves risks. Past performance, whether actual or indicated by historical tests of strategies, is no guarantee of future performance or success. There is a possibility that you may sustain a loss equal to or greater than your entire investment regardless of which asset class you trade (equities, options, futures, or digital assets); therefore, you should not invest or risk money that you cannot afford to lose. Before trading any asset class, first read the relevant risk disclosure statements on the Important Documents page, found here: www.tradestation.com .

$DXCM Some nice symmetries in this chart all 3 legs are equal.. wave 5 stopped at expected target, bearish divergence at 5 vs 3 . 3 down from highs but looking heavy here .

DXCM Short - Breakout RejectionI'm a bit surprised this isn't getting more attention here. Breakout failed about the channel on a few price upgrades.--> That shouldn't be enough to hold a rally and is proving itself out. Short position entered at 102, PT on this would be 95 on volume profile, then 85 based on gap fill if it picks up steam.

DXCM - growth play?Everything is red, especially after last weeks volatility. This stock here seems to be a tech company primarily focused on medical technology seemingly with target for our geriatric community here in the US. I haven't done much research but from a chart analysis I see the potentiality for this stock to play out strong in the future.

$DXCM with a Bullish outlook following its earnings #Stocks The PEAD projected a Bullish outlook for $DXCM after a Negative over reaction following its earnings release placing the stock in drift C with an expected accuracy of 12.71%.
RectangleEarnings miss.
Short interest 3.3%.
Neutral pattern until a trendline is broken with a confirmed trend.
No recommendation