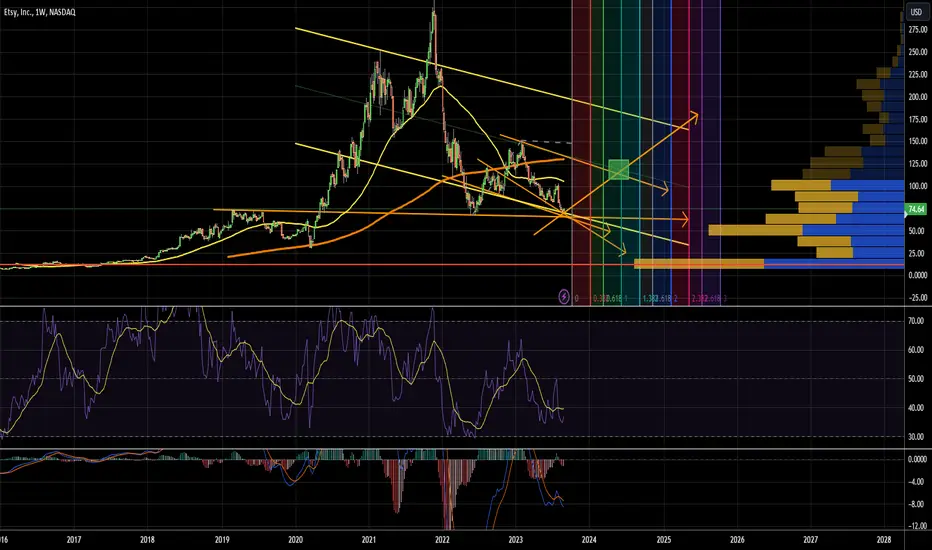
ETSY - Possible 2x, Who is interested? No doubt ETSY is a sh##y stock, but looks like it found a temporary bottom here.
Build long between 70-80
Stop loss - 65
Target #1 - 100
Target #2 - 115
Target #3 - 130
Target #4 - 150, after a pullback
ETSY trade ideas

ETSY Options Ahead of EarningsIf you haven`t sold ETSY before the previous earnings:
Then analyzing the options chain and the chart patterns of ETSY prior to the earnings report this week,
I would consider purchasing the 75usd strike price Puts with
an expiration date of 2024-2-23,
for a premium of approximately $3.50.
If these options prove to be profitable prior to the earnings release, I would sell at least half of them.

Etsy Faces Uphill Battle Amidst Shifting Consumer TrendsThe recent analysis of Etsy's ( NASDAQ:ETSY ) stock performance reveals a sobering reality: the platform's forecast for the first quarter paints a picture of subdued demand, signaling potential trouble ahead.
The Handcrafted Conundrum
Etsy Inc.'s., ( NASDAQ:ETSY ) cautionary outlook stems from a confluence of factors, chief among them being the waning appetite for handcrafted goods and personalized gifts, long considered the lifeblood of its marketplace. In an era marked by economic uncertainty and tightened purse strings, consumers are exercising restraint, gravitating towards essentials over indulgences. The discretionary spending squeeze in the United States serves as a stark reminder of the shifting dynamics in consumer behavior.
Market Response and Competition Intensifies
Unsurprisingly, investors reacted to Etsy's ( NASDAQ:ETSY ) projections with a discernible unease, with the company's shares witnessing a 8% dip in extended trading. Compounding the issue is the intensified competition from both traditional retailers and emerging e-commerce players, all vying for a slice of the consumer pie. Deep discounts and promotional blitzes have become the norm, amplifying the challenge for Etsy ( NASDAQ:ETSY ) and its sellers to stand out amidst the noise.
Strategic Adjustments Amidst Headwinds
In response to the evolving landscape, Etsy ( NASDAQ:ETSY ) has embarked on a multifaceted strategy aimed at bolstering its market position and supporting its community of sellers. Efforts to enhance marketing support and experimentation with promotional initiatives underscore the company's commitment to adaptability. However, these measures have come at a cost, with margins taking a hit in the fourth quarter, reflecting the inherent trade-offs in a fiercely competitive environment.
Navigating Uncertainty with Resilience
As Etsy ( NASDAQ:ETSY ) grapples with the repercussions of soft demand and heightened competition, questions loom over its ability to weather the storm. The recent workforce reduction initiative and emphasis on cost reduction reflect a proactive stance toward mitigating the impact of market headwinds. Yet, the path forward remains fraught with challenges, necessitating agility and innovation to stay afloat in an ever-evolving marketplace.
Conclusion:
Etsy's ( NASDAQ:ETSY ) journey stands as a testament to the enduring complexities of the e-commerce landscape. While the road ahead may be fraught with obstacles, the company's resilience and adaptability offer glimmers of hope amidst uncertainty. As it navigates the tumultuous seas of shifting consumer trends and intensified competition, Etsy ( NASDAQ:ETSY ) remains a beacon for creators and artisans, forging ahead with determination in pursuit of its vision.

$ETSY - Would you swing it?NASDAQ:ETSY This is another one that is forming a cup and handle base. MACD and RSI trending up.
The ER will determine $61 or $90.
Upside Targets:
$85
$90
$97
Downside risk:
$61

ETSY Long at key support levelEtsy is backtesting a massive historical level after springing above it following a false breakdown. The false breakdown also completed a bullish shark at the 886 on the weekly.
Full pattern and targets shown below.

Correction cycleThe cycle from 2016 of 5 waves has ended and we are going to the ABC correction. Now there is a correction of C, it should end at ~50-55$

$ETSY - can it break out?NASDAQ:ETSY is currently up against the upper trendline channel resistance. If it can break above this resistance, it has the potential for further upside.
Upside targets:
$75
$80
$94
Downside risk:
$61

Long-term double bottom formation on ETSYThe price has been gradually forming the second leg of a long-term double bottom on ETSY

CSP ideaI just sold CSP at strike 65 expire on 11/10. I don't mind if the get assigned, actually I want that. I would keep the premium and the stock. I think it has a lot potential to the upside just need a little patience. The CSP of Etsy pay very well.

For long term holdersPrices is landing on a strong support area. I don't think is going to bounce right away, it needs some accumulation first. But if you have a long term view, you can buy some now and buy more in a few weeks if price still trading close to the support zone.

Etsy Potential Major Support Bounce Trade IdeaHi guys! This is a technical analysis on Etsy (ETSY) on the 3 Day timeframe, supporting a potential Support Bounce Play.
We've come a long way from our recent Rejection off the "Major Resistance" Red Trendline.
Moving below the 21 EMA (Purple line)
Breaking Below our previous Support Trend line Turned Resistance Line (Black Horizontal line)
To now come in contact with Major Support.
Notice how in Previous interactions with this "Major Support", we have bounced for price gains.
The key is not the percentage gains but simply the fact that we bounce from here.
Our previous candle printing a Bullish Engulfing candle and current candle also in the process of confirming. This supports the idea of further price increases as it indicates buying pressure.
If history is any indication, also remembering that its not an exact reference. We can say that it is "probable" that we BOUNCE from here.
Since its our 3rd touch point in all of the history of ETSY's price action. This also adds to my bounce projection.
Price action tends to react around Support/ Resistance trendlines.
If this holds true, our target for this bounce idea, would be the "Re-test" of the Support Turned Resistance line or "Target 1 Sell Zone".
The 21 EMA also converges currently at the level. So this can be another line we interact with.
STOCH RSI is a great indicator to combine with this idea as it depicts when bullish or bearish momentum comes into trends.
We are currently BELOW the 20 level, but have CROSSED BULLISH.
Everytime we've done this in Previous History, and have CROSSED ABOVE the 20 level it has lead to a Bounce off the Support.
With all that has been said, this is a Critical Area to watch for Etsy.
__________________________________________________________________________________
Thank you for taking the time to read my analysis. Hope it helped keep you informed. Please do support my ideas by boosting, following me and commenting. Thanks again.
Stay tuned for more updates on ETSY in the near future.
If you have any questions, do reach out. Thank you again.
DISCLAIMER: This is not financial advice, i am not a financial advisor. The thoughts expressed in the posts are my opinion and for educational purposes. Do not use my ideas for the basis of your trading strategy, make sure to work out your own strategy and when trading always spend majority of your time on risk management strateg

ETSYEtsy: broke down impulsively invalidated the bullish count. Most likely it will retest bottom around 69-70

$ETSY confluence the confluenceNASDAQ:ETSY got to a price where there was confluence on the confluence. If this does not bounce here, I don't know where else it would.
I would like it to use the jetpack to get to $115 ish on the mid point from our channel.
Yieahhhh
Etsy - Bounce Test Not going to give too much commentary here.
The setup at the support zone is pretty clear.
Previous earnings came in well above estimates.
I like this setup, if you choose to act on it, Trade Safe! 👻

ETSY Stock Analysis: Strong Financials and Bullish Targets AheadCertainly, let's expand on the details.
Over the last six quarters, Etsy has shown an upward trend in both Earnings Per Share (EPS) and Revenue. In Q2 2023, Etsy's EPS was $0.83, surpassing the estimated $0.41 by a significant margin. Revenue has also been growing consistently, although at a slower pace compared to EPS. In the same quarter, Gross Merchandise Sales (GMS) rose by 7.5% year-over-year to $628.9 million, an indicator of the platform's increasing popularity.
Moreover, the company's take rate, which is the consolidated revenue divided by consolidated GMS, stood at 20.9%. This metric indicates how well Etsy is able to monetize its transactions. On the profitability front, Etsy reported a net income of $141.1 million and an adjusted EBITDA of $294.3 million, underlining the company's strong financial management.
In addition to its financial performance, Etsy's management has laid out an ambitious roadmap for 2023, targeting a GMS growth of 15% to 20%. This is indicative of the company's confidence in its growth prospects, supported by an increasing user base and marketplace Gross Merchandise Sales (GMS).
Investor attention is particularly high as the stock has reached a pivotal reversing level. Technical analysis suggests that if the stock maintains its bullish momentum, the next key resistance levels to watch are at $78.7, followed by $83.2, $86.8, and eventually reaching $90.
Given the company's strong financial performance in recent quarters and the optimistic outlook presented by management, these price targets appear achievable. Investors seeking exposure to the e-commerce sector would do well to consider Etsy, especially given its strong fundamentals and growth prospects.

$ETSY - Looking like a reversalNASDAQ:ETSY I took a starter position today. $70 support held. MACD, William R% and RSI is curling up.
Targets - $82, $95, $100, $120

$ETSY - at critical support areaOn May 30th, I posted that NASDAQ:ETSY could reach the $74-$70 area. The target was hit last week.
I am tempted to take a starter position here.
The current support of $70 is critical. Otherwise, it could fall further to $60.

ETSY - Can Bulls Hang On?We broke beneath the long-term support line a few weeks ago (barely), and for the first time ever for the stock, our key MAs have crossed bearish on the monthly. That's 2 strikes against this one... Next key support is $30-$40 range, meaning another 50% down from here.

$ETSY long ideaNASDAQ:ETSY is in its daily demand zone.
observed a 15 min Choch and trying to see if this would span in my way.
what do you think ?

Bullish Alert : ETSYThe 15 minutes chart sees a Bullish Alert and Bullish crossover.
There is a gap left open at $95.5
We need here a positive price action to be built with the next candles.

Etsy Double Bottom?Etsy forming a clean W shape double bottom. Although it has potential to the downside, with the current bulls only market environment, upside is more likely. Playing this with a tight stop. High Risk trade.

ETSY +50%Etsy, Inc. is an American e-commerce company focused on handmade or vintage items and craft supplies. These items fall under a wide range of categories, including jewelry, bags, clothing, home décor and furniture, toys, art, as well as craft supplies and tools. Items described as vintage must be at least 20 years old.

$ETSY: A Promising Comeback Candidate with a Bullish "W" PatternDuring the bullish run of 2020-2021, Etsy Inc. ( NASDAQ:ETSY ) emerged as a notable name in the US financial markets. However, the stock experienced some turbulence in recent times. In my opinion, Etsy is poised for a comeback this year, presenting a compelling short to medium-term trade opportunity.
A Bullish W Pattern Emerging
One of the key indicators supporting Etsy's potential revival is the formation of a W pattern on the price chart. The W pattern is considered a bullish reversal pattern, signifying a potential upward trend reversal. This chart pattern suggests that Etsy's downtrend may be coming to an end, setting the stage for a bullish move.
The Ideal Entry Point
For traders looking to capitalize on Etsy's potential rebound, the ideal entry point would be a daily close above $98. This level would confirm the completion of the W pattern and indicate a potential shift in sentiment. A decisive close above this price level would signal a bullish trend, making it an opportune time to consider long positions.
Price Targets for Short to Medium-Term Trades
In light of the W pattern formation and potential trend reversal, it is essential to set reasonable price targets for short to medium-term trades on Etsy. Based on technical analysis, the Price Targets for NASDAQ:ETSY are projected at $115, $122, and $128. These levels represent potential resistance points that Etsy's stock could aim to break through as it regains momentum.
Risk Management
As with any trade, it is essential to practice sound risk management strategies. Setting stop-loss orders at appropriate levels can help mitigate potential losses in case the trade does not play out as expected. Additionally, monitoring the stock's price action and overall market conditions can guide informed decision-making throughout the trade duration.
Conclusion
Etsy Inc. ( NASDAQ:ETSY ) has captured the attention of traders during its bullish run in 2020-2021. Despite facing some headwinds in recent times, the emergence of a bullish W pattern on the price chart suggests the stock may be on the verge of a comeback. For traders seeking a short to medium-term trade opportunity, a daily close above $98 could signal an ideal entry point. With Price Targets projected at $115, $122, and $128, Etsy's potential resurgence presents an exciting prospect for those seeking to capitalize on the stock's future gains. As always, diligent risk management and staying informed about market developments are crucial elements of successful trading.
