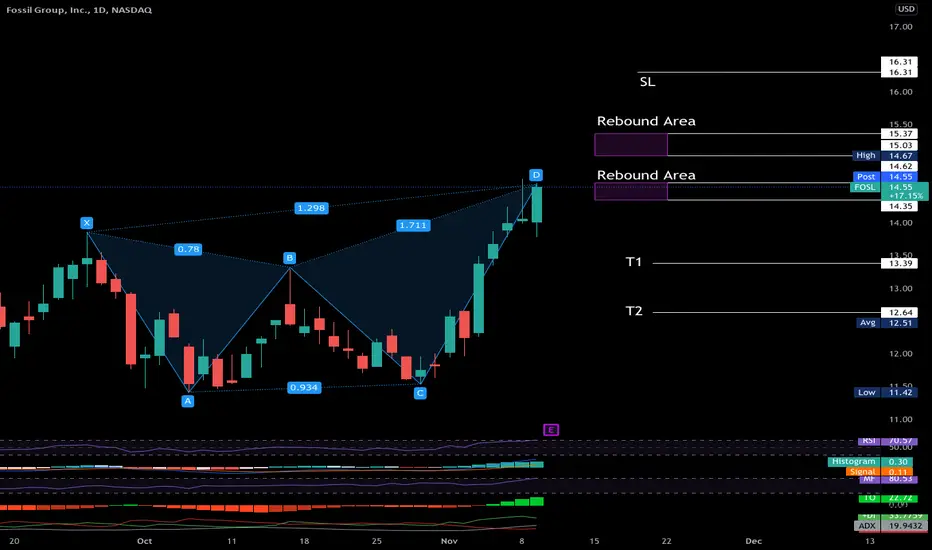
Looks good before earningsInverted HS, earnings upcoming on 11/07. Stock history shows that the stock doesn't change the trend after earnings. I opened a position ion Friday but still good to to buy.
Next report date
—
Report period
—
EPS estimate
—
Revenue estimate
—
−1.6715 EUR
−99.18 M EUR
1.11 B EUR
46.78 M
About Fossil Group, Inc.
Sector
Industry
CEO
Franco Fogliato
Website
Headquarters
Richardson
Founded
1984
FIGI
BBG00MVHHLH6
Fossil Group, Inc. engages in the design, marketing and distribution of consumer fashion accessories. The firm operates through the following geographical segments: Americas, Europe, and Asia. Its products include men's and women's fashion watches, jewelry, handbags, small leather goods, belts, sunglasses, shoes, soft accessories and clothing which are sold through department stores, specialty retail locations, specialty watch and jewelry stores, owned retail and factory outlet stores, mass market stores, owned, and affiliate internet sites. The company was founded by Tom Kartsotis in 1984 and is headquartered in Richardson, TX.
Related stocks

Fossil Group (NASDAQ: FOSL) Forming a Descending Wedge Pattern FOSL has been in a downtrend since June 2021, when it reached a 52-week high of $6.08. The stock has formed a descending wedge pattern, which is a bullish reversal pattern that indicates a possible breakout to the upside.
The stock has recently crossed above the resistance line of the wedge, which

FOSSIL Stock Chart Fibonacci Analysis 050323Trading Idea
1) Find a FIBO slingshot
2) Check FIBO 61.80% level
3) Entry Point > 3.34/61.80%

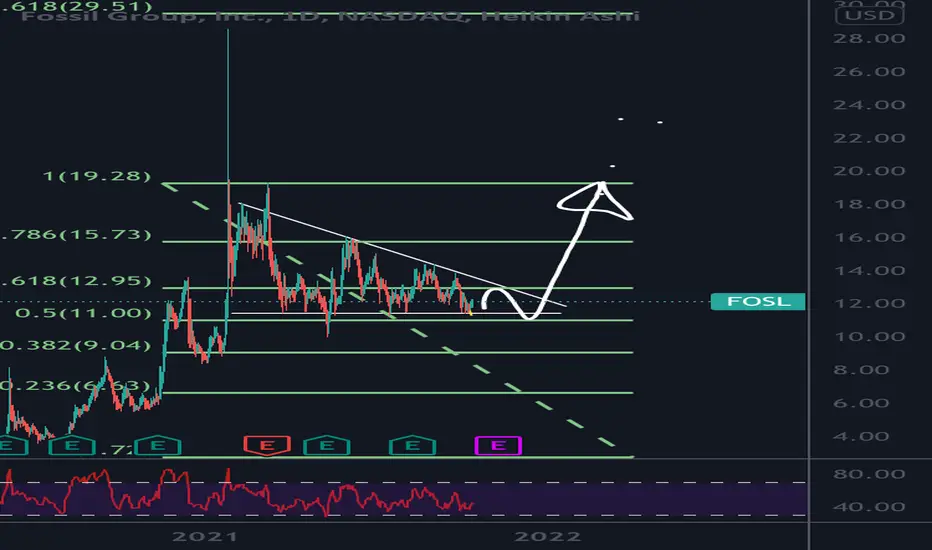
Yuuuge possible upside from... $FOSL?!We've got a working trend line the price has nearly met, a nice little pocket of a wedge we're working to fill, a double bottom, and bottomed out fibonacci retracements... Might this be a good buy for a doubling or tripling of money, in the next year? This little wedge looks like it might take a num

Fossil Group Weekly Technical AnalysisFOSL Weekly - No RECOMMENDATION or ADVICE Status / EDUCATIONAL only - Support, Resistance, Trend Lines , Parallel Channels, Confluences - Hope it Helps, Good Luck

Buy $FOSL - NRPicks 17 DecFossil Group, Inc. designs, develops, markets and distributes consumer fashion accessories in the United States, Europe, Asia and internationally. The company offers its products under its proprietary brands, such as FOSSIL, SKAGEN, MICHELE; and under licensed brands, ARMANI and BMW.
Revenue TTM 1.

FoslFosl is living on this 11.45 support. I’m super impressed how it held up here. Deep consolidation within these ranges. I’d be a buyer of that level unless of course it breaks. As long as it above 11.45 it’s a buy area ! Big targets for this thing when it finally rips out of this range

FoslMy buddy pointed this one out to me had me look at the chart, all I can see is a solid uptrend this thing likes to rip when it gets a nice bounce. It looks like it has a down trending resistance squeezing it against long-term support. It has a lot of support from ichumochi cloud at 1372 I feel thi

See all ideas
Summarizing what the indicators are suggesting.
Neutral
SellBuy
Strong sellStrong buy
Strong sellSellNeutralBuyStrong buy
Neutral
SellBuy
Strong sellStrong buy
Strong sellSellNeutralBuyStrong buy
Neutral
SellBuy
Strong sellStrong buy
Strong sellSellNeutralBuyStrong buy
An aggregate view of professional's ratings.
Neutral
SellBuy
Strong sellStrong buy
Strong sellSellNeutralBuyStrong buy
Neutral
SellBuy
Strong sellStrong buy
Strong sellSellNeutralBuyStrong buy
Neutral
SellBuy
Strong sellStrong buy
Strong sellSellNeutralBuyStrong buy
Displays a symbol's price movements over previous years to identify recurring trends.
Curated watchlists where FOSL is featured.

Frequently Asked Questions
The current price of FOSL is 1.5500 EUR — it has increased by 1.64% in the past 24 hours. Watch FOSSIL GROUP INC stock price performance more closely on the chart.
Depending on the exchange, the stock ticker may vary. For instance, on VIE exchange FOSSIL GROUP INC stocks are traded under the ticker FOSL.
FOSL stock has risen by 9.70% compared to the previous week, the month change is a 35.08% rise, over the last year FOSSIL GROUP INC has showed a 37.17% increase.
We've gathered analysts' opinions on FOSSIL GROUP INC future price: according to them, FOSL price has a max estimate of 4.24 EUR and a min estimate of 4.24 EUR. Watch FOSL chart and read a more detailed FOSSIL GROUP INC stock forecast: see what analysts think of FOSSIL GROUP INC and suggest that you do with its stocks.
FOSL reached its all-time high on Nov 26, 2018 with the price of 19.4900 EUR, and its all-time low was 0.7130 EUR and was reached on Apr 30, 2024. View more price dynamics on FOSL chart.
See other stocks reaching their highest and lowest prices.
See other stocks reaching their highest and lowest prices.
FOSL stock is 2.96% volatile and has beta coefficient of 0.94. Track FOSSIL GROUP INC stock price on the chart and check out the list of the most volatile stocks — is FOSSIL GROUP INC there?
Today FOSSIL GROUP INC has the market capitalization of 84.01 M, it has decreased by −8.66% over the last week.
Yes, you can track FOSSIL GROUP INC financials in yearly and quarterly reports right on TradingView.
FOSSIL GROUP INC is going to release the next earnings report on Aug 6, 2025. Keep track of upcoming events with our Earnings Calendar.
FOSL net income for the last quarter is −16.25 M EUR, while the quarter before that showed −7.34 M EUR of net income which accounts for −121.30% change. Track more FOSSIL GROUP INC financial stats to get the full picture.
No, FOSL doesn't pay any dividends to its shareholders. But don't worry, we've prepared a list of high-dividend stocks for you.
As of Jul 26, 2025, the company has 5.2 K employees. See our rating of the largest employees — is FOSSIL GROUP INC on this list?
EBITDA measures a company's operating performance, its growth signifies an improvement in the efficiency of a company. FOSSIL GROUP INC EBITDA is 7.68 M EUR, and current EBITDA margin is −1.64%. See more stats in FOSSIL GROUP INC financial statements.
Like other stocks, FOSL shares are traded on stock exchanges, e.g. Nasdaq, Nyse, Euronext, and the easiest way to buy them is through an online stock broker. To do this, you need to open an account and follow a broker's procedures, then start trading. You can trade FOSSIL GROUP INC stock right from TradingView charts — choose your broker and connect to your account.
Investing in stocks requires a comprehensive research: you should carefully study all the available data, e.g. company's financials, related news, and its technical analysis. So FOSSIL GROUP INC technincal analysis shows the buy rating today, and its 1 week rating is buy. Since market conditions are prone to changes, it's worth looking a bit further into the future — according to the 1 month rating FOSSIL GROUP INC stock shows the neutral signal. See more of FOSSIL GROUP INC technicals for a more comprehensive analysis.
If you're still not sure, try looking for inspiration in our curated watchlists.
If you're still not sure, try looking for inspiration in our curated watchlists.