Barclays Raises TechnipFMC (FTI) Price Target to $43TechnipFMC (NYSE: NYSE:FTI ) closed at $31.23 on the previous trading day, staying close to its one-year high of $33.45. Evercore ISI analyst Jason Bandel maintained a Buy rating on the stock, setting a price target of $39. Meanwhile, Barclays reaffirmed its Buy rating with a higher target of $43 in a report dated March 26.
Currently, the consensus among Wall Street analysts rates TechnipFMC as a “Strong Buy.” The average price target stands at $37.22, suggesting an upside of 19.18% from current levels. The stock has an average daily trading volume of 4.33 million shares. TechnipFMC’s performance is under close watch, though analyst Jason Bandel has posted a -5.4% average return with a 31.58% success rate. He follows the energy sector, covering companies like Helmerich & Payne and NOV in addition to FTI.
Insider activity on the stock shows negative sentiment. Over the past quarter, 55 corporate insiders have sold shares. Earlier this month, Director Eleazar de Carvalho Filho sold 9,381 shares worth $279,178.56.
Technical Analysis
The stock recently bounced off a key support zone around $22, close to the 200-day moving average at $21.86. This bounce formed a bullish reversal setup. The price is now hovering near $25.20. If it holds this area, the next resistance is around the $28.00 level, followed by a possible move back toward its recent high of $33.45.
The volume profile shows increased buying near the bottom of the bounce, suggesting accumulation. RSI is around 42, indicating neutral momentum but potential for recovery if buying pressure continues. A break above $28 may signal continuation toward $33.45.
FTI trade ideas

Buying TechnipFMC Bonds- Issuer: TechnipFMC
- ISIN: FR0011273432
- Coupon: 4.00% in euros (payment 1 time per year)
- Repayment: June 15, 2027
- Yield to maturity: 5.46%
- Rating: BBB-
- Award: +2% for assets of similar quality
Justification of the purchase:
TechnipFMC is a leading international company operating in the oil and gas technology sector, with a focus on the development and implementation of subsea solutions for oil and gas production. Despite the challenges in the industry, such as the volatility of commodity markets, the company demonstrates sustainability and good financial results. Its leadership in innovative technologies aimed at reducing the carbon footprint underpins long-term growth prospects.
TechnipFMC's financial performance in 2024 showed positive dynamics:
- An increase in adjusted EBITDA by 47% to $379 million.
- A record order book worth $13.9 billion, which ensures revenue sustainability in the coming years.
These indicators make TechnipFMC bonds an attractive tool for investors, offering a yield of 5.46%, which is 2% higher than the average yields on similar securities.
Reasons for the discount:
TechnipFMC bonds are traded at a small discount, which is due to several factors:
1. Revenue decline in the Surface Technologies segment: In the first quarter of 2024, revenue in this segment decreased by 14% due to the sale of the Measurement Solutions division and a decrease in activity in North America.
2. Restructuring costs: The company has completed several restructuring processes, which temporarily affected profitability. Despite this, positive results from these changes are expected in the medium term.
3. Margin pressure: Margin pressure has been observed in some regions, which has led to a 70% decrease in operating profit in the Surface Technologies segment compared to the previous quarter.
Despite these short-term challenges, TechnipFMC has good growth prospects due to a significant portfolio of orders and a leading position in the underwater technology sector. Strong operational performance and stable financial results support the long-term sustainability of the company.
Conclusion:
We recommend the purchase of TechnipFMC bonds, as the current discount provides an opportunity to receive a premium of 2% to similar securities, as well as a reliable income of 5.46%.

FTI & oil next week: UPMy dowsing picked this stock in November or so and on 11/16 gave today as a future date to watch for a move up.
Twice I get the "safe and profitable to buy" option today and parabolic daily chart option. Twice I get a target of $26, which seems kinda nuts ;) but that's fine.
It might be a better entry on Monday, but the date was today, so...
It also seems it could be pretty swift action and is confirmed by similar bullishness in USO. I will also make an idea for USO with a target, tho my old idea still stands I believe for a push into the 90s.
I'm doing something new asking for a rating of 0-10 for the opportunity in different stocks, and this comes as a 10. My intention for a 10 rating is the options move 100s of percent during the duration of the trade. I don't want to fool with anything under an 8. It would be swell if this would work, but time will tell.

Clear winner in this sell off marketGood run on higher than average volume. Adding to watchlist. Can be a leader when market turns NYSE:FTI

Oil stocks moving BUY!!Oil stocks are moving. Buy the strong ones. This is a good chance to move your account by 7 - 15% in a month!! with a risk of about 3%
NYSE:OII NYSE:TDW NYSE:FTI NYSE:TTI NYSE:HLX
Reasoning
Whole Industry is moving!
Consolidation seems done
Correction is not overextended
Good Relative Strength
Great earnings
RSI tested bullish range multiple times
Multiple Bullish Days
Always try to use 2 timeframes
My Would Be Trade Plan
- Try to get into 3 stocks in the sector that are moving. You MUST enter the leading stock because the leading stock always moves 50% more than the second stock in sector
- Initially risk 0.75% and then double position once stock moves 5% in your favour. (1.5% position)
- If Position moves 20% in less than 15 bars, sell at 7ATR from initial buy ELSE Sell at 4ATR from initial buy
- Raise stop to entry when stock is 10% in your favour
- If, you have doubled position. Exit if stop closes below initial buy! Else keep original stop
Main Sources of My Knowledge
Mark Minervini
Constance Brown
William O'neil
Speakers on Trader Lion Youtube
Adam Khoo
My Indicators
14 Period MFI.
13SMA and 33EMA Moving Averages added
Composite by Constance Brown
This is for catching failures in the RSI.
The RSI is a bounded indicator so sometimes fails to catch divergences. This indicator helps show that
Composite Settings
Author : Constance Brown (Connie Brown)
RSI Length : 14
RSI Momentum Length : 9
SMA Length : 3
Fast Simple Moving Average : 13
Slow Exponential Moving Average : 33

Buder Trend Trade on FTITrend trade on FTI(not FTX, lol).
Why I like this idea:
1. Strong, healthy bullish market structure(higher highs, lower lows for months)
2. Well defined channel
3. 50 EMA is acting as support
5. Local fixed range volume area as support
6. Local fixed range volume POC as support
7. A confluence of fib levels such as GC, 382 and 236.
Entry price is at local GC(14.16) and stop loss is just below last higher low(12.90). Take profit one around 15.35 and take profit 2 around 16.97. TP2 is based on a negative fib retracement level as well as the psychological 17.00. Take profits are more subjective but make sure you take some profits and protect from losses. I prefer to move stop loss up to entry price after take profit 1.

$FTI ~ Expect run to continue...Expect run to continue as shown. With this administration remaining hawkish towards oil, off shore requirements will continue to increase.

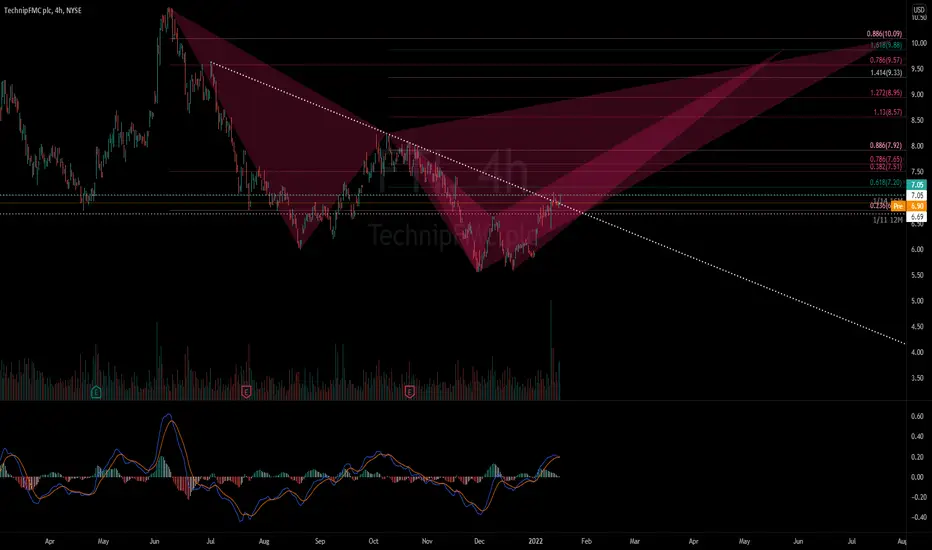
FTI long the oil service and equipment industry has been on fire and there are still some stocks in the sector that have not run as hard as their peers. I think FTI is one of them. Pretty large order flow the past week aswell. I would like this to get over 7.05 and base will prob see a little rejection around 7.20 area may expect little consolidation between the 7.05 and 7.20 area. I also really like how it broke and retested the down trend. one of my top watches this week
fti buybuy after the break and above the resistance level at 6.90 .. first target next resistance level 7.95 .. finally target 9.00

TechnipFMC Awarded Large Subsea Contract for Additional StabroekFTI: TechnipFMC plc
2021-11-15 16:15:00
TechnipFMC Awarded Large Subsea Contract for Additional Stabroek Block Project


When a one year old resistance line just wont go away.Vertical trend broken now back to old resistance line but will turn back to support line fairly soon. Unfortunately wont see much support till around earnings time.


$FTI - its time to make some moolahIt is hard to find a ticker that will perform in a down market, but not impossible.
I use various tools to identify which way a sector is headed and what tickers have potential within a sector that may be doing better than the rest.
Using one of my tools i came across FTI and find the ATR is supportive, MACD and stochastic have done an about face with a golden cross on the horizon.
In addition to finding various stocks with potential, I use backward looking data to find cycles that may again produce some gains.
on FTI i find that if you purchased this stock on 12/31/2020 and sold on 1/14/2021 the return would be 25.4%.
The short volume on 12/31 was 38% and rose to 48% on 1/14.
Today the short volume is at 48%, if this comes down over the next couple of days then this looks like a stock I may pick up, as the market continues its pull back

the b[AI]te's weekly insights -- FTI 2021-03-01center stage image
stock
our system found that FTI received the best image over the course of last week.
comment image
we see a moderate positive correlation with our image indicator. We therefore assume that prices are driven partial emotionally as there is probably some other catalyst with regard to the company resulting in an uncertain pricing.
new free tool
we launched our new free analysis tool. Check our website and test it out!
new free and powerful data API
you can now access our data via our free API . Check our website and test it out!
FAQ
ATTENTION
our algorithms define ATTENTION as the overall number of stories and opinions that appear for a given security each day.
IMAGE
our algorithms define IMAGE as the averaged sentiment value extracted from all opinions received for a given security per day.


FTI Technical Analysis 🧙TechnipFMC is the largest provider of integrated deep-water offshore oil and gas development solutions, offering the full spectrum of subsea equipment and subsea engineering and construction services. Additionally, the company provides various oil and gas onshore engineering and construction services, with a long-standing expertise in delivering liquefied natural gas projects.
If you understand the idea,🎯 press a thumb up! 👍 Have a question? Don't be shy to ask! 🤓 Interested to study how to analyze charts, follow me!


$FTI - Green englufing candleHaven't seen this stock before. Green engulfing, recent gap ups, volume spike, back above 20ma. Would watch for a gap up tomorrow. Anybody know anything about this one?


FTI consolidation break-out!NYSE:FTI
- FTI has been trading sideways for months
- The stock is now approaching the upper end
- MACD sloping up
- RSI still room to go - not overbought
- Golden cross took place
