GE trade ideas

GE seems like an incredible buying opportunityGE seems like an incredible buying opportunity just turned from a sell to a buy with huge institutional buy-in

Super high chance of hitting 12$ in the near termThe 6$ line is solid support gained from the monthly timeframe and the 12$ line is what i call soft resistance (a lot of activity here). What really is weird is how it closed on Friday. Check out the blue line, it was support and now is dead on resistance confirmed on Friday's close. Coincidence? Hmmmm. With all my oscillators pointing up and volume increasing i think it's primed for a hell of a break out. One can be conservative and straddle this but a big move is coming and my money's to the up side. 12$ within a month or 2. Let me know what y'all think :)

General Electric - GE Stock Analysis The Idea is to go long but only if the 10 USD resistance level will be broken. (so Hold for now)
The other option is to wait the end of the price retracement and when it reaches the 8 USD go long
NYSE:GE

GE | Short | Fill the gapNYSE:GE
Possible scenario: SHORT for fill the GAP
Evidence: Bearish Divergence, Bearish Candlestick
It's just my opinion and could be wrong
GE False SignalGE had a false signal, and will not continue to go up yet. It will have to fall down to support level 1 or 2 to gain buying pressure. After this, the stock will either consolidate and continue to go in a channel, or breakout above resistance.

GE is a Buy!It looked like the gap GE had was not a breakaway gap, though now it is looking different. GE has a bullish engulfing pattern and an ADX of 46! This means it is extremely likely this trend will continue. Thanks, Like, and follow.


GE ABout to Double upWell Folks seems to me as if GE is getting ready to get back on its feet. ON 1 August 2000 GE was valued at 58.15 at its highest point and ever since seemed to be failing. That loosing streak that GE was in since the 2000s seems to be fading away very quickly. After December 3rd 2018 2 more lower lowes. 1st October 2020 to me is a jstart of many more wonderful gains on company such as GE. DYOR Not intended to be investment advice.

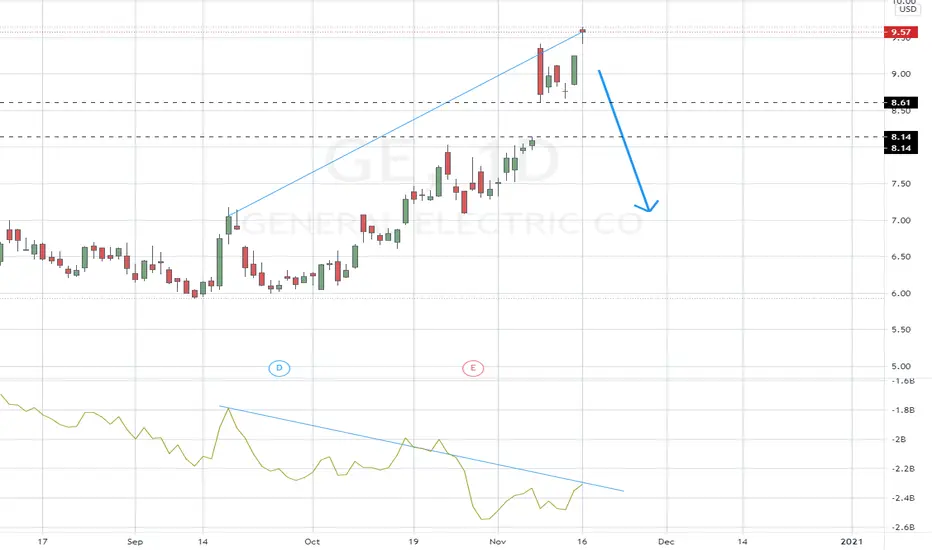
Long term "Go" flagged on General ElectricLast week flagged a “Go” trend for the first time since the crash in March on GE. We can also see that current price action has moved above the resistance set by the runaway gap.
The GoNoGo Oscillator led this change in trend by breaking above the zero line several bars ago and rallying into positive territory on heavy volume.

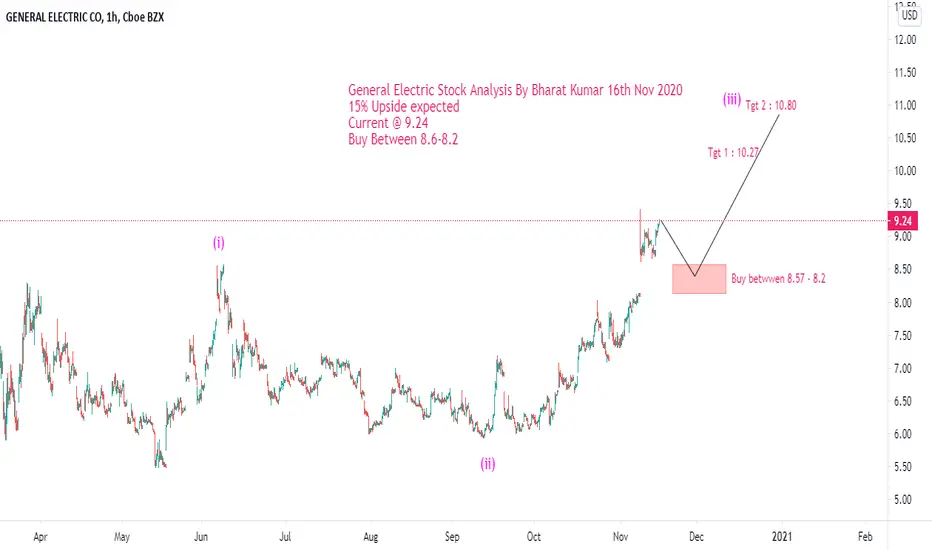
General Electric Stock AnalysisGeneral Electric Stock Analysis 16th Nov 2020
15% Upside expected
Current @ 9.24
Buy Between 8.6-8.2

GE AnalysisGE had a gap, which could possibly be a breakaway gap. Then there is a Bullish Harami, and could keep going up. The ADX was also at 37, which means it is a strong trend.

$GEMy past swing trades on $GE closed out of half position from entry at $6.25. Believe this could play out as long as the key levels hold.


How to Trade the Breakout of a Range 101In this post, we will learn how to trade the breakout of a clear range. Let's start learning.
a) First of all, we need a clear Range ( we can say that is clear when we have a support and a resistance level and the price in between for a considerable amount of time)
b) From a technical perspective, the expected movement after a range is broken is the extension of it in the broken direction (green arrow)
c) Also, we will see how that projected movement fits in the context of the chart. In this case, we will look for the next resistance zone.
d) The correct way of identifying a resistance zone is by looking for clear reversal movements in the past. Ignore small corrections. Look for reversal movement and define it with a horizontal line ( in this case, we used 2 yellow arcs to show the idea)
e) Now you can see two things. 1) The projected distance of the range is very similar to the distance towards the next resistance zone 2) You have good space to try to catch a wave
f) But how can I trade a situation like this? You need a CONFIRMATION. In this case, we always wait for corrective structures (remember that corrective structures can be Flat, Zig Zag, Triangles, or Irregulars)
g) Wait for a clear corrective structure on the Edge of the broken Range. IF that happens, you need to define its edges, and from now, it's straightforward. (You can also look for a corrective structure on a lower timeframe; for example, if you define the range on the 4HS chart, you can change your timeframe to the 1H chart.)
h) Open positions on the Breakout of the structure, Set stop loss below the structure, Set take profit on the next resistance zone, Define the risk you will take on the trade
i) Use this as an archetype on how to trade this type of structure.
Have a great day!

$GE$GE formed a nice rounded bottom pattern.
It's moving forward by making higher highs absorbing all the supplies.
Now need a volume spike for a breakout from the neckline of the rounded bottom pattern.


$GE finallyGE has been consolidating for a while, now it seems that report is finally showing signs of recovering by the business, all Ichimoku conservative signals being met, good opportunity for reaching a good profit in the short term.

