GEwho is going to save it now? let it die? what are the chances well i think they won't but i think this time goverment will let buffet and friends save this zombies companies on 2018 warren was saying that they would buy it at the right price but what is the right price?
2008 warren made a mistake and bought the company before it bottoms and had to wait a long time to make his money back what is the price i think he will make it different this time maybe 2 to 3$ a share .
GE trade ideas

Down channelHow long has it been in this channel? Long enough. Market pull back will be dangerous for GE. Laying off some of the brightest men/women in the aircraft engines division was not enough for the market. They want more. You can hire a monkey in a suite at any time. Can't get back years of engineering experience and skills once gone. I think GE is killing its best parts to keep the gangrene of management stuck to it, sucking it dry till nothing is left. Leadership at GE died decades ago.

GE: about to explode?This stock holding on at strong support above 6$.
The 240 min chart shows possible breakout of the triangle pattern.
On the bull side : breakout can push GE to the target area ( in green ) as first target.
On the bear side : massive sell off possible if support not holding. stay tuned!

Long opportunity for GE in Wave C long target $8.36Looks like possible ABC zigzag pattern for GE, just finishing up Wave B as Wave A was 5 waves, we can expect Wave B not to break the starting point of Wave A. Fib extension has a target of $8.36.

Descending Triangle - Bottom ReversalDescending triangle indicating the bottom for GE and a potential reversal soon.

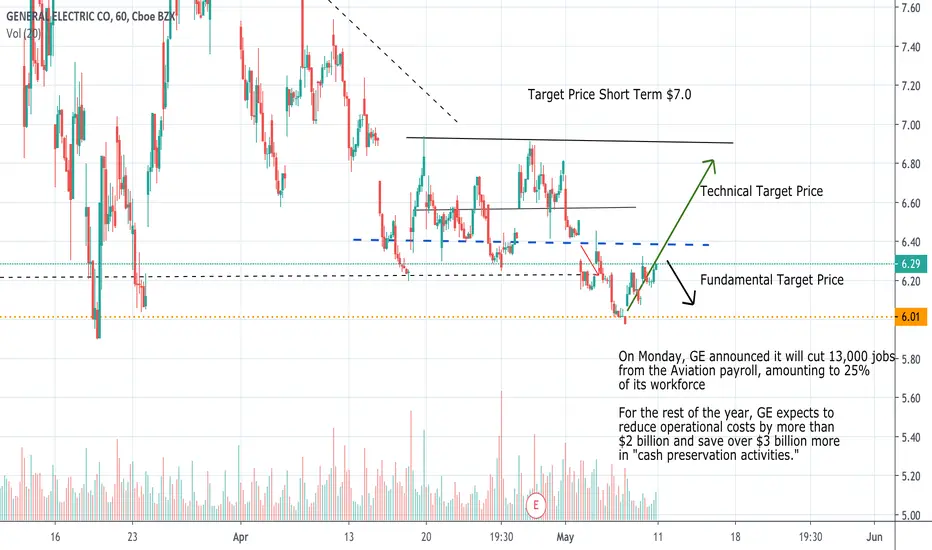
General Electric - GE Technical Analysis vs Fundamental AnalysiBased on Technical Analysis, we are just waiting the right signal to buy - but HOLD for now
Fundamental Analysis would suggest to hold.
On Monday, GE announced it will cut 13,000 jobs from the Aviation payroll, amounting to 25% of its workforce.
This news has already been discounted by the prices.
For the rest of the year, GE expects to reduce operational costs by more than $2 billion and save over $3 billion more in "cash preservation activities."
General Electric has had a difficult run in recent years, weighed down by market-topping acquisitions and a huge debt load. The company showed signs of a recovery in 2019, but the shares are now down 44% year to date in 2020.
We knew heading into 2020 that GE had serious issues with its energy business and with other units, and still had work to do bringing down debt. Aviation was supposed to be a counterweight for those issues, providing earnings stability and free cash flow.
GE ready to catch up w/ the rest of the market!General Electric looks ready to catch up with the rest of the market. It continues to be held down and consolidate. I expect quite a comeback from a company that certainly isn't going to vanish. I fully expect this to have a full recovery. 50%+ gains in the short term. Check the chart and let me know what you think! Happy Friday all!

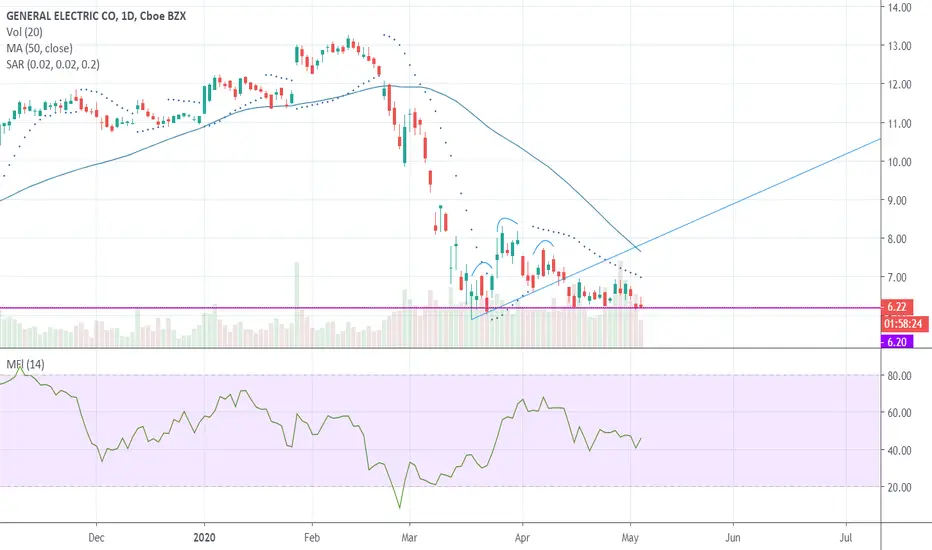
GE testing prior lows as GoNoGo Trend remains strongly "NoGo"GE is testing the March lows on the Daily GoNoGo chart. There hasn’t been much to be bullish about though for General Electric as the GoNoGo Trend indicator is consistently painting bearish purple and pink bars. While there may be some support at these levels the prevailing trend is down.
In fact, we recently saw a red re-entry circle which signaled a renewed push down to these lows.
As you’d expect, the GoNoGo Oscillator has been negative during this entire move and has found resistance at the zero line.
We’d need to see enough bullish momentum to push the GoNoGo Oscillator above zero before there would be any confidence that this downtrend is over.

Long GE + Other CI (WEEKLY)Critical Infrastructure (Aviation, Energy, etc.) will see bounceback after COVID-19.
Activities during COVID-19 have been in noble aid to the national interest.
Once the virus begins to leave the spotlight high volume business activities will return, stabilizing the share price.
Long term trade -- Optimum target: ~March 2021

GE More Down Side to Come (Revised)General Electric Company (NYSE: GE )
What is General Electric Company:
Is a diversified corporation and will its products include from electrical and electronic equipment, aircraft engines, and financial services.
JesusTrades Score:
Sell
Scale Score:
Risky (8/10)
Portfolio Hold:
1 month

Support shelf about to give wayGE has strong buyer support at 6.20. With lower highs, it is a matter of time this shelf breaks to the allow downside movement of prices. Technical indicators lean towards lower prices.
Caveat Emptor and good luck!
I am going down, down, downThe shelf finally broke. How low will we go? March lows is very near and then 2008 lows are next. After that, watch out!
Interestingly, I am seeing divergences on MFI. There is an upside potential but when? Difficult to answer.

Is $GE Headed Even Lower..?If Oil and Interest Rates can trade BELOW zero... $GE can at least trade CLOSE to zero. Definitely not something we're betting on, but anything is possible these days. Price is breaking down from an 18-month range below key lows around $6. A measured move of this pattern breakdown targets prices below NEGATIVE 1 for what it's worth.


Sellers show up for GEThe sellers must have grown tired of waiting for the price to pick up and they finally decided to sell at whatever price they are getting. There is plenty of downside opportunity for GE from indicators. We should see red candles with increasing volume for confirmation. Don't know about targets. I "feel" it will go lower than the March lows.
Caveat Emptor and good luck!

Bearish on GEFrom price action, I am bearish on GE now. There was a huge surge in buying 2-3 days ago after which two things happened - the volume went down and the price started moving down. This means the buyers who were holding the price up have disappeared and the market is searching for the next lower level that will be attractive to the next batch of buyers. What will that be is anyone's guess but I would look at around 6.25 where the previous buyers jumped in an pumped it up. Loss of that will likely lead to a lower low. Daily MFI is pretty limp right now.
Caveat Emptor and good luck!

Bottom Here or $1.45 (GE)This one could get fun.
General Electric Company is a global digital industrial company. The Company's products and services range from aircraft engines, power generation, and oil and gas production equipment to medical imaging, financing and industrial products.

GE falling wedge, it’s a great time to longGE is in a falling wedge pattern which is a bullish pattern. There are two profit targets, with the last one being 10$. After the falling wedge pattern it might keep going up. Look closely at this one, the rise could happen soon. Check the link down below for some more charts by me.
(Not giving financial advice)

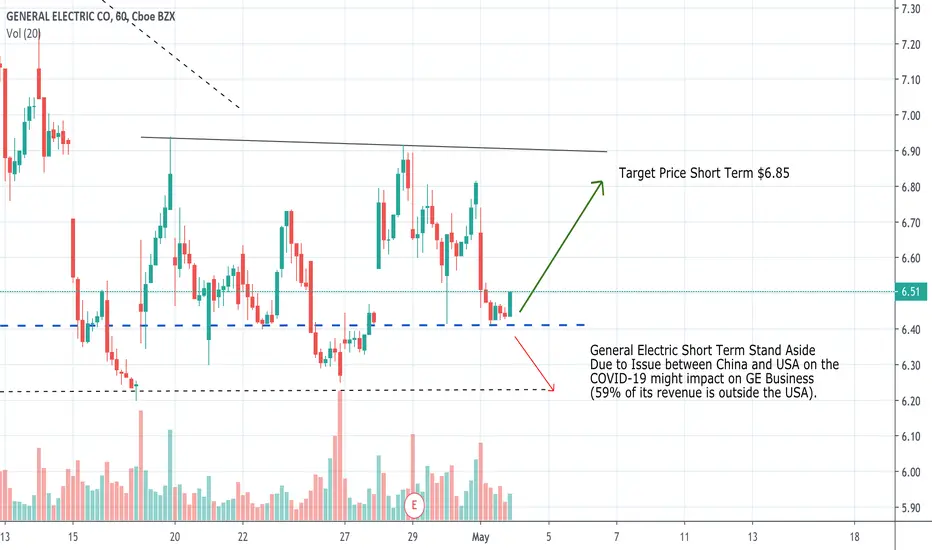
General Electric Technical Analysis - Stand AsideNYSE:GE
Technical Analysis seems to have found a signal to buy up to $6.85, but due to the Fundamental info, I would stand Aside right now.
The Issue between China and USA over the COVID-19 might impact on GE Business (59% of its revenue is outside the USA).
Credit Suisse lowered its price target on GE to $8 (they might be on Hold)
Long term investment, we could see GE stock rise over the next three years to $13, or even $20 per share.
GENERAL ELECTRIC CO (GE) Monthly, Weekly & DailyDates in the future with the greatest probability for a price high or price low.
The Djinn Predictive Indicators are simple mathematical equations. Once an equation is given to Siri the algorithm provides the future price swing date. Djinn Indicators work on all charts, for any asset category and in all time frames. Occasionally a Djinn Predictive Indicator will miss its prediction date by one candlestick. If multiple Djinn prediction dates are missed and are plowed through by same color Henikin Ashi candles the asset is being "reset". The "reset" is complete when Henikin Ashi candles are back in sync with Djinn price high or low prediction dates.
One way the Djinn Indicator is used to enter and exit trades:
For best results trade in the direction of the trend.
The Linear Regression channel is used to determine trend direction. The Linear Regression is set at 2 -2 30.
When a green Henikin Ashi candle intersects with the linear regression upper deviation line (green line) and both indicators intersect with a Djinn prediction date a sell is triggered.
When a red Henikin Ashi candle intersects with the linear regression lower deviation line (red line) and both indicators intersect with a Djinn prediction date a buy is triggered.
This trading strategy works on daily, weekly and Monthly Djinn Predictive charts.
Trades made when the monthly, weekly and daily arrows are pointing in the same direction are the most profitable.
This is not trading advice. Trade at your own risk.

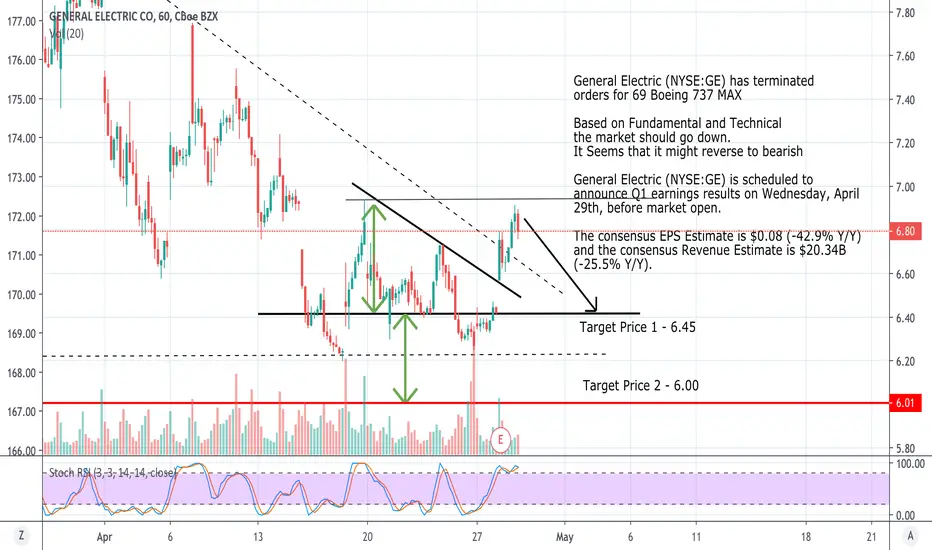
GE - General Electric - Wait for the Earning ReportGeneral Electric (NYSE:GE) has terminated orders for 69 Boeing 737 MAX
Based on Fundamental and Technical the market should go down.It Seems that it might reverse to bearish - Volume does not confirms a potential reversal pattern
General Electric (NYSE:GE) is scheduled to announce Q1 earnings results on Wednesday, April 29th, before market open (US Time) - in a couple of hours
Estimate Earning Report Results:
The consensus EPS Estimate is $0.08 (-42.9% Y/Y) and the consensus Revenue Estimate is $20.34B (-25.5% Y/Y).
Shortening $GE at a Target of $9.13First off, please don't take anything I say seriously or as financial advice. That being said, let me get into a few key points. GE also has GE Healthcare systems which has its Ventilator solutions as well as virtual care and telemedicine (amongst other things). This is why I don't think GE is going to have as bad of a quarter as other corporations during the Covid19 period. It also doesn't have another earnings call until July 29th, giving others a chance to be bullish. I expect at least a $9.13 price target to be reasonable for a short sell. It also may have higher then 34%+ as a long call potential, but it is still too early to call given GE's mostly bearish history in the recent years.

GE breakout of descending triangle or rebound from double bottomAlthough the descending triangle is technically a bearish pattern, the price movement seen here can also be considered a double-bottom. In that case, the price should rise upward and possibly create a channel.
RSI and MACD are not giving any clear signals.
Recent analysts' recommendations all say that GE is a buy at this point.
Overall, I would say that this idea has a 50-50 chance of working. However, the risk to reward ratio is ~4.5 and possible gains of 24% which is pretty good. I'm gonna enter in long and see how it goes
