GE trade ideas

GE is GEAerospace a buy 5% below its ATH? - LONGGE is now priced at 5% below its recent ATH. The daily chart shows it to be on a VWAP breakout
over two standard deviations above the mean anchored VWAP originating in 2 and a half years
ago. Price has dipped and pulled back to the midline of the Bollinger Bands and buying volatility
is fading as can be seen on the indicators. I see this as a safe point to add to my GE long
positions of shares and call options. Having trimmed some of those positions 4 weeks ago, I
will add the same amount back in along with 20% extra. When earnings are upcoming in
August I will again look for a pivot high from which to trim again.

GE Possible Head and Shoulders Pattern GE and the whole Aerospace and Defense industry have been relatively strong as of late. However we are entering into the Memorial Day weekend and the low volume that comes with it. On May 8th General Electric’s price pushed up to the $170 level, a level with a large amount of options interest. This $170 strike is considered the Call Wall and an area of large resistance. Since then prices have pulled back and are currently sitting on what I believe to be another big support level at $160, a large options strike. The $160.00 level also looks to be the “neckline” of a head and shoulders pattern. If this plays out, $149.92 would be the target area.
Thanks for reading! Stay disciplined and stay green!

GE Very OverextendedParabolic run most likely triggered by spike in utilities as those who missed the AI bubble wanted to find an underlayer to get returns in.
Downside price targets of: 158.69, 134.03, trail stop for the rest

GE General Electric Company Options Ahead of EarningsIf you haven`t bought GE before the previous earnings:
Then analyzing the options chain and the chart patterns of GE General Electric Company prior to the earnings report this week,
I would consider purchasing the 155usd strike price Calls with
an expiration date of 2024-8-16,
for a premium of approximately $8.50.
If these options prove to be profitable prior to the earnings release, I would sell at least half of them.

GE Aerospace Needs to CorrectAfter many years of struggle due to the Banking Debacle of 2008, this venerable old company is finally showing strength again. Spinning off divisions to focus on and drive growth in the key businesses was exactly what was needed.
NYSE:GE Aerospace is over-speculated now. The run up from the heavy accumulation during the last half of 2023 is too steep to sustain. Smaller funds have been driving it upward since March, causing the more volatile action recently.
It had a small gap up on earnings this week but it still needs to correct, either down or sideways . It has the look of a stock with short-term topping risk at the moment, but extended sideways action could adjust out the overextended uptrend instead.

GE Aerospace Surges 6.37% On Earnings ReportGeneral Electric ( NYSE:GE ), a prominent global conglomerate, experienced a 6.37% surge in its stock prices following the release of its Q1 report. GE Aerospace, a subsidiary of General Electric, exceeded Q1 expectations, which included results for GE Vernova before the spinoff.
GE Aerospace reported standalone adjusted earnings of 92 cents per share for the quarter. Solo adjusted revenue saw a 15% increase to $8.1 billion. On a consolidated basis, adjusted earnings for both GE Aerospace and GE Vernova were 82 cents per share, with consolidated GAAP earnings amounting to $1.38 per share. Total consolidated revenue increased by 11% to $16.1 billion, surpassing FactSet analysts' expectations of 65 cents per share on $15.25 billion in revenue.
Total orders for GE Aerospace rose 34% to $11 billion, primarily driven by orders for commercial engines and services. The company registered free cash flow of $1.7 billion for the quarter.
For fiscal 2024, GE Aerospace projects an adjusted earnings range of $3.80 to $4.05 per share, with free cash flow exceeding $5 billion. GE Aerospace raised its total operating profit outlook from $6 billion to $6.5 billion to $6.2 billion to $6.6 billion. GE anticipates mid-to-high teens growth in commercial engines and services revenue. It lifted its operating profit outlook for the business segment by $0.1 billion to $6.1 billion to $6.4 billion. GE Aerospace expects defense and propulsion technologies revenue to rise in the mid-to-high-single-digits, with its defense operating profit ranging from $1 billion to $1.3 billion.
In early March, GE Aerospace adjusted its 2025 revenue outlook to low double-digit growth. It also forecasts an operating profit of roughly $7.3 billion as the midpoint for the year, to reach an operating profit of $10 billion in 2028.
GE Aerospace plans to deliver approximately 70% to 75% of cash to shareholders through dividends and share buybacks, including an initial dividend payout at 30% of net income, subject to board approval, and $15 billion in share buybacks.
TD Cowen upgraded GE stock to buy from hold on April 9, citing GE Aerospace's commercial aftermarket prospects in light of Boeing production issues. Over 50% of GE Aerospace sales and 75% of its profits come from the commercial aerospace aftermarket following the spinoff. The firm raised its price target on GE shares to $180 from $175.
NYSE:GE stock has rallied 4.6% early Tuesday. Shares rose 1.4% Monday, bouncing off their 21-day exponential moving average. NYSE:GE stock jumped 37% in 2024 leading up to the April 2 spinout. GE Aerospace stock saw a nearly 54% increase so far this year and is trading at its highest level since July 2016.

GE Completes Historic $191.9 Bil Breakup, Launches GE AerospaceIn a groundbreaking move that has sent ripples through the financial world, General Electric ( NYSE:GE ) has completed its long-anticipated $191.9 billion breakup, marking a pivotal moment in its storied history. With bullish investors eagerly eyeing the horizon.
The journey towards this momentous milestone has been nothing short of extraordinary. Despite facing headwinds and challenges along the way, NYSE:GE has demonstrated resilience and unwavering determination under the leadership of CEO Larry Culp. Today, as the dust settles and the applause reverberates across Wall Street, GE Aerospace stands tall as a testament to the power of strategic vision and bold execution.
The spinoff of GE Aerospace ( NYSE:GE ) marks the final chapter in GE's ambitious restructuring plan, which saw the conglomerate splitting into three distinct entities focused on aerospace, healthcare, and energy. This strategic realignment not only unlocks value but also provides investors with greater transparency and clarity in capital allocation—a crucial step towards revitalizing shareholder confidence.
Under the seasoned stewardship of H. Lawrence Culp Jr., GE Aerospace embarks on its maiden flight with unwavering resolve and a clear sense of purpose. With a strong balance sheet and a relentless focus on innovation, the company is primed to chart new territories and shape the future of aviation.
At the heart of GE Aerospace's strategy lies FLIGHT DECK, a proprietary lean operating model that epitomizes efficiency and agility. Armed with this powerful tool, the company is well-positioned to navigate the complexities of the aerospace industry and deliver unparalleled value to its customers, employees, and shareholders alike.
With an impressive portfolio boasting approximately 44,000 commercial engines and 26,000 military and defense engines worldwide, GE Aerospace ( NYSE:GE ) commands a dominant position in propulsion, services, and systems. The company's robust financial performance, with adjusted revenue of approximately $32 billion in 2023, underscores its resilience and market leadership.
Looking ahead, GE Aerospace ( NYSE:GE ) has set ambitious targets, reaffirming its 2024 guidance and presenting a compelling long-term financial outlook. With a steadfast commitment to delivering operating profit of around $10 billion by 2028, the company is charting a course towards sustained growth and value creation.
The launch of GE Aerospace ( NYSE:GE ) not only marks the culmination of GE's multi-year transformation journey but also signifies a new chapter in the company's illustrious history. Through prudent capital allocation and a relentless pursuit of excellence, GE has laid the groundwork for a brighter future—one defined by innovation, resilience, and unwavering commitment to success.
As shareholders eagerly await GE Aerospace's first-quarter earnings announcement on April 23, 2024, the stage is set for a new era of prosperity and growth. With a stellar lineup of advisors including Paul, Weiss, Rifkind, Wharton & Garrison LLP, Evercore, Morgan Stanley, and PJT Partners, GE Aerospace is well-equipped to navigate the complexities of the financial landscape and emerge victorious.
GE March 15, 24: A High Tight FlagOn March 15, 24 the stock NYSE:GE seems to move in a high tight flag pattern. Closing in green amid a weak overall market proves its relative strength.
A very strong stock during this uptrend.
A strong move out above this flag with volume confirmation, for me, would present a good buying opportunity.

GE continues its bullrun LONGGE on the weekly chart has been in a trend up with some corrections along the way since a
double bottom in the summer of 2022. It has had some sections spin-off including the health
care poriton of the company. This company as a mega-cap industrial with cash on hand
is independent of interest rate concerns. Much of its business in long term contracts. I see
GE as a great long-term long trade. I am focused on accumulating long shares as well an
options into 2026. The last correction on this chart was this past October. I will average more
in at this time but am really looking for another smaller correction like last October for a
bigger buy to add to the positions. GE is safe from the volatility of most of the technology
stocks and in my opinion, is a good stock to "back up the truck".

GE ideasNew stock to me. looking for an upside move preferably. a slight dip off the bottom for a real good run at the top. best viewed on the 7 minute timeframe.
premarket will tell all

GE has a solid ongoing trend higher LONGGE on a 240 minute chart shows an anchored VWAP and volume profile both anchored back into
October and a price action breakout beginning after the November earnings report and
sustained through the early February earnings report. Both reports showed significant beats
on earnings as well as good beats on revenue. I see GE as a solid long term long swing trade
into at least the next earnings in about ten weeks. Another approach aside investing is
a long term call option more than one year out to capture the tax advantage of the long- term
capital gains tax rate. I will zoom into a 30 minute time frame and go long with the best
entry of a pivot low.

GE Buy the Pullback ( Flip the switch) now LONG I previously published the idea of shorting GE. It has now pulled back more than 4%
on the retreacement. The short idea paid well using put options to profit from the
pump of earnings expectations. Earnings were great but the run up was too much for
traders. GE has now retreated and is ready for a long entry. Price is now in the
undervalued range of both the short and intermediate term VWAP bands.
The target is $99.99which is basically the price immediately before the earnings report.
Confirmation is tbe zero lag MACD where the K/D lines crossed under the histogram and are heading
together to cross over the zero line while the histogram flipped from negative to positive.
Call options in the money expiring 5/5 are considered.

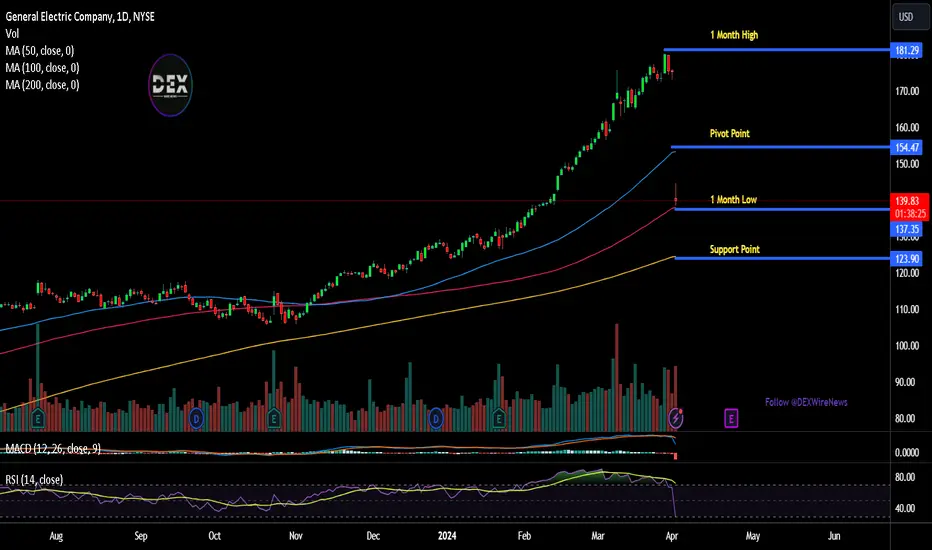
GE heads up at $137: confluence of Golden Fibs to watchAs you know, GE has been blazing upwards.
It has just hit a confluence of major fibs.
Looking for a pullback or Break-and-Retest.
Given the strength, it is likely to continue higher.
But it might be worth selling some of it around here.
Or one could move stop loss to just below this zone.
================================================
.

GE grows and splits. Stock idea 07/02/2024General Electric Co. has announced a company split aimed at increasing its business efficiency. Following the division, two companies will emerge: GE Aerospace, a manufacturer of solutions for the aerospace industry, and GE Vernova, which combines the energy divisions of GE Power and GE Renewable Energy. Investors who own GE stock will receive a stake in both companies.
So, today, we have decided to look at the General Electric Co. (NYSE: GE) stock chart.
On the D1 timeframe, support has formed at 132.12, but resistance is yet to be established. There is a high probability of a corrective decline in quotes to the 134.28 level, which previously served as resistance.
On the H1 timeframe, a rebound from the 134.28 level could set a short-term target for a price increase at 139.07, while in the medium term, it could hover around 146.00.
—
Ideas and other content presented on this page should not be considered as guidance for trading or an investment advice. RoboMarkets bears no responsibility for trading results based on trading opinions described in these analytical reviews.
The material presented and the information contained herein is for information purposes only and in no way should be considered as the provision of investment advice for the purposes of Investment Firms Law L. 87(I)/2017 of the Republic of Cyprus or any other form of personal advice or recommendation, which relates to certain types of transactions with certain types of financial instruments.
Risk Warning: CFDs are complex instruments and come with a high risk of losing money rapidly due to leverage. 66.02% of retail investor accounts lose money when trading CFDs with this provider. You should consider whether you understand how CFDs work and whether you can afford to take the high risk of losing your money.

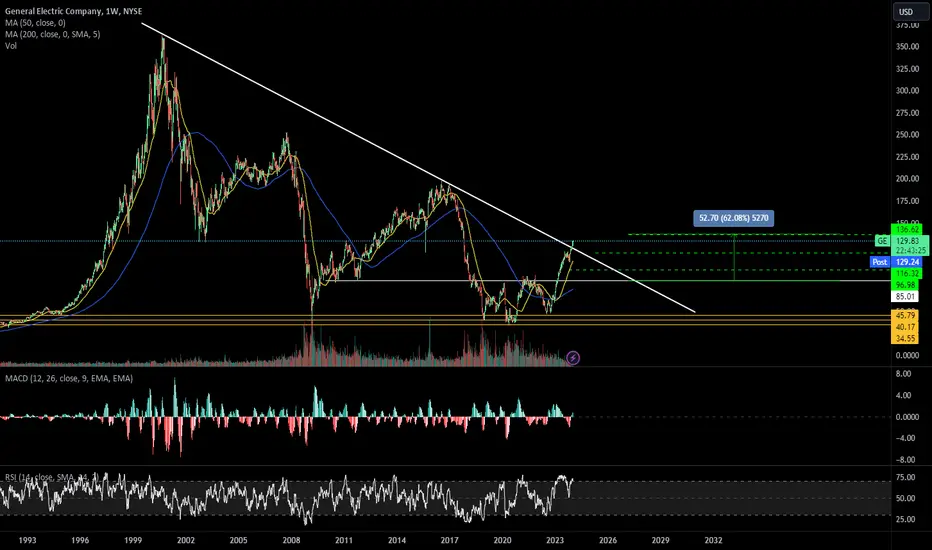
"GE Stock Faces Retracement to $80-$90 Range"Navigating GE Stock: Market Overview and Potential Retracement
General Electric (GE) stock, a stalwart of the industrial sector, is currently under scrutiny as investors assess its performance amidst changing market conditions. With the recent push-up from 2020 to 2024 showing signs of exhaustion, GE may be poised for a retracement to the $80-$90 range. This retracement could test the micro upward trend while remaining within a massive downward range channel, presenting key support and resistance levels for strategic buying and selling opportunities. However, if GE fails to hold the $80-$90 price range, it could signal a continuation of the downward trend, potentially leading to another significant drop.
Understanding GE Stock
GE is a multinational conglomerate with interests spanning across various industries, including aviation, healthcare, renewable energy, and more. As one of the oldest and most well-known companies in the United States, GE has a storied history of innovation and resilience. However, in recent years, the company has faced challenges, including restructuring efforts, asset divestitures, and changes in leadership, which have impacted its stock performance.
Current Market Conditions
In the midst of ongoing market volatility and economic uncertainty, GE stock has been subject to fluctuations driven by a combination of internal and external factors. While the recent push-up from 2020 to 2024 provided some relief for investors, signs of exhaustion have emerged, raising concerns about the sustainability of the uptrend. With the possibility of a retracement looming, investors are closely monitoring GE's price action for potential buying or selling opportunities.
Retracement Potential
The anticipated retracement to the $80-$90 range represents a critical juncture for GE stock. This price level not only serves as a test of the micro upward trend but also aligns with major support and resistance levels within the broader downward range channel. For investors, this presents an opportunity to capitalize on strategic entry or exit points, depending on their outlook for GE's future performance.
Key Buying and Selling Opportunities
Within the context of the retracement, key support and resistance levels provide valuable insights for investors seeking to capitalize on buying or selling opportunities. By identifying these levels and monitoring price action closely, investors can make informed decisions to maximize their returns while managing risk effectively.
Potential Downside Risk
While the retracement to the $80-$90 range offers potential buying opportunities, there remains a significant downside risk if GE fails to hold this price level. A breach of support could trigger a cascade of selling pressure, leading to another massive drop in GE stock. Investors should exercise caution and remain vigilant in monitoring GE's price action to mitigate potential losses.
Conclusion
In conclusion, GE stock is facing a pivotal moment as it navigates changing market conditions and the potential for a retracement to the $80-$90 range. While the recent push-up from 2020 to 2024 provided a glimmer of hope for investors, signs of exhaustion suggest caution is warranted. By carefully analyzing key support and resistance levels within the broader downward range channel, investors can position themselves strategically to capitalize on potential buying or selling opportunities while managing risk effectively in the face of uncertainty.

GE: Short-Term Appears Overextended; Support Zone 112-118The upward trend in GE stock is evident, but there seems to be a short-term overextension. In the event of a potential correction, entry points within the support zone of 112 to 118 could be considered favorable. Resistance levels are seen around 130 and 135.

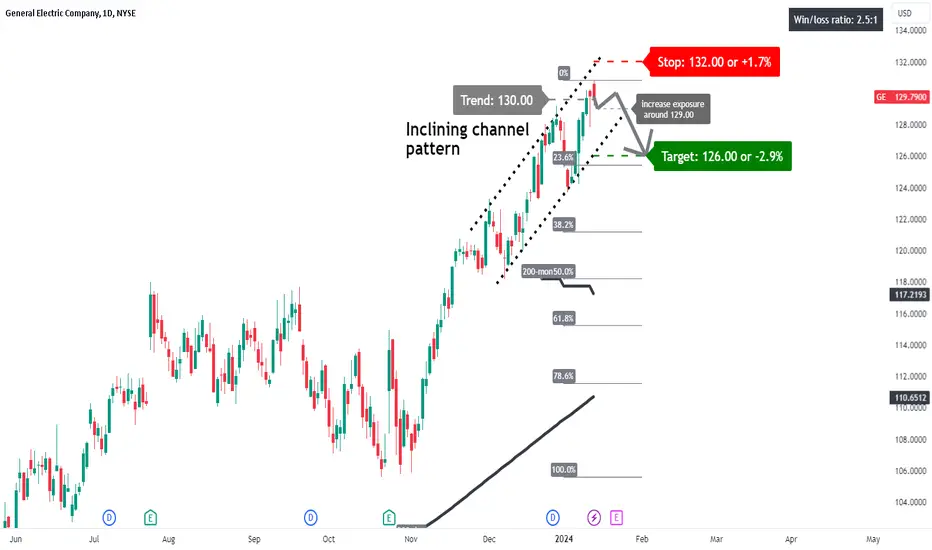
GE: retrace back to its 23.6% Fibonacci retracement level?A price action below 130.00 supports a bearish trend direction.
Expect further downside price potential for a break below 129.00.
The target price is set at 126.00 (its 23.6% Fibonacci retracement level).
The stop-loss price is set at 132.00 (upper range of the inclining channel pattern).
The price movement within the inclining channel pattern indicates that the correction could be temporary.

GE: retrace back to its 23.6% Fibonacci retracement level?A price action below 130.00 supports a bearish trend direction.
Expect further downside potential for a break below 129.00.
The target price is set at 126.00 (its 23.6% Fibonacci retracement level).
The stop-loss price is set at 132.00 (upper range of the inclining channel pattern).
The price action in an inclining channel pattern suggest that the correction might be temporary.
Longest GE Idea of All TimeThis Weekly GE chart has been setting up for the past two year basically and it has come to my attention we have finally crossed the creek.
oh btw, im back and for good this time.
Happy Trading
GE - Showing Signs of Topping ActionRSI is dropping below 70 showing signs of lack of bullish strength. I believe this stock is likely to pullback a bit.

Tightening in this channel. GE seems to be potentially consolidating to break out higher. This channel seems to be consolidating. Wonder what everyone else’s thoughts are.

GE, SELL, -4.09%, LOSSShort selling NYSE:GE on 10/23/2023 at market close and closed the position on 10/24/2023 at market open. Net -4.09% loss.
